You would use the complex conjugate when correlating any complex data, such as an FFT result. Thus if a signal has a magnitude and phase, when correlated we multiply by the same magnitude and opposite phase-- this cancels out the phase in each product contribution the maximum to the overall correlation result (as a sum of products, or equivalently in the continuous time domain and integration of products).
Consider a simple example of correlating a 3 sample complex sequence:
$$x[n] = [e^{j\phi _1}, e^{j\phi _2}, e^{j\phi _3}]$$
Correlation is a sum of complex-conjugate products, specifically for an auto-correlation (not the auto-correlation function where we would repeat this at each time offset, but just the correlation at time index = 0):
$$\rho_{xx} = \sum_{n=0}^2 x[n]x^*[n]$$
We see here how due to the complex conjugate product, each product will equal 1 in this case and we would get the maximum correlation of 3:
$$\rho_{xx} = e^{j\phi _1}e^{-j\phi _1}+e^{j\phi _2}e^{-j\phi _2}+e^{j\phi _3}e^{-j\phi _3} = 3$$
If we did not correctly use a complex conjugate product, then for any phase values other than $0$ and $\pi$ (which means the sample is real and thus is already its own complex conjugate), the summation would be less than the maximum 3 that we achieved.
UPDATE Regarding Correlating with Just Magnitudes
Vatatia asked in the comments more specifically about using the product of the magnitude of complex waveforms (such as the FFT result) for the correlation rather than the complex conjugate products. This can be done and will provide a correlation result, but will have significantly more noise than operating on the complex values directly. This is consistent with the difference between "pre-detection" and "post-detection averaging, a great example is a spectrum analyzer for those that are familiar with that instrument: adjusting "Resolution Bandwidth" is adjusting the bandwidth of a filter prior to detection (taking the magnitude) and results in a decrease in the total power of the measured noise floor. In contrast, adjusting "Video Bandwidth" is adjusting the bandwidth of a filter post detection (filtering the output of a power detector) and only serves to smooth the measured noise but does not decrease the measured noise floor. The noise on the complex samples for many processes tends to be additive white Gaussian noise, which when zero mean will average toward zero, while this same noise once detected (magnitude of the complex signal) will be Rayleigh distributed which is NOT zero mean and will therefore accumulate in the average. Correlation for discrete time waveforms is a process of multiplying and adding (accumulating). As we add zero mean noise, sometimes it will add to the result and sometimes it will take away given it can be positive and negative; but if we take the magnitude first, it will always be positive and the result for the noise components will always go up. I can demonstrate this with a simple example in MATLAB of a sinusoidal tone in the presence of additive white Gaussian noise, and the resulting autocorrelation in frequency with and without taking the magnitude in the correlation.
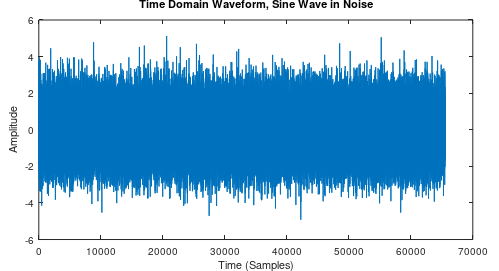
wvfrm = randn(1, 2**16)+sin(2*pi*.01 .* [1:2**16])
Below is a plot of the test waveform; a real sine wave of amplitude 1 buried in real Gaussian noise with a variance of 1:
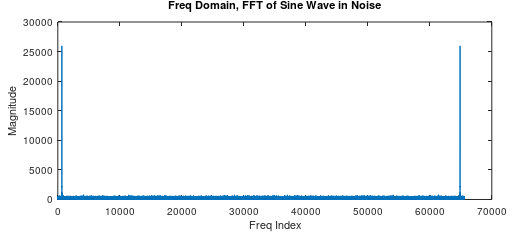
Below if a plot of the magnitude of the FFT of this waveform; which is a complex result:
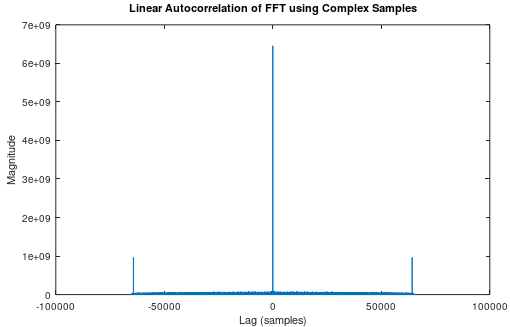
The xcorr command will do a linear cross correlation (or auto-correlation when we only enter one waveform, or the same waveform twice), and as explained in the documentation for the function, it will take the complex conjugate product when processing. Below shows a plot of the result for doing the autocorrelation of the FFT result:
[autocorr, lag] = xcorr(fft(wvfrm))
Plot of magnitude of autocorrelation:
Now observe what happens when we do the same operation, except with the magnitude of the fft instead of the complex result:
[autocorr2, lag] = xcorr(abs(fft(wvfrm)))
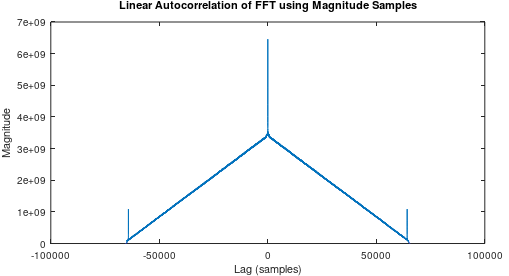
What we see here is the significant accumulation of the noise floor when we used the magnitude of the waveform to compute the correlation rather than the complex result. (The floor is a triangular shape since this command used performs a linear correlation; if a circular correlation is done as described further below, the noise floor would be flat at the higher level in vicinity of the main correlation peak). Bottom line, using a magnitude to compute the correlation will lead to significant noise enhancement, even though the result will correctly show the same correlation peaks.
The Fourier Transform equation itself is a good example of the correlation of complex signals; for each frequency considered (represented as a single complex tone given as $e^{j\omega t}$) with a frequency $\omega$ radians/sec, we multiply our complex time domain signal ($x(t)$) by the complex conjugate for that frequency tone ($e^{-j\omega t}$), and integrate the product, resulting in the correlation at that specific frequency $\omega$:
$$X(\omega) = \int_{-\infty}^{\infty}x(t)e^{-j\omega t}$$
We also see the complex conjugate put to practice when we use the FFT to perform fast correlation; circular cross-correlation in the time domain is equivalent to the inverse FFT of the complex-conjugate product of the FFT's in the frequency domain:
$$\rho_{xy} = \text{IFFT}\{\text{FFT}\{y\}\text{FFT}^*\{x\}\}$$
Where $\text{FFT}^*\{x\}$ represents the complex conjugate of the FFT of x[n].
Similarly if we wanted to correlate FFT's directly (as a correlation function vs frequency offset index $m$) we could do this as:
$$\rho_{XY}[m] =\sum_{n=0}^{N-1}X^*[k]Y[k+m] \tag{1} \label{1}$$
Where:
$X[k], Y[k]$: are the FFT for $x[n], y[n]$
$k$ is the frequency index from $0$ to $N-1$
$n$ is the time index from $0$ to $N-1$
for $N$ samples in time and frequency.
$\rho_{XY}[m]$ is the correlation of the FFT results versus frequency offset index $m$.
Changing which variable gets indexed and which gets complex conjugated would change the interpretation of the shift in frequency for each correlation result. Importantly and not accurately represented in the simplified formulation above, $Y(k+m)$ is a circular shift of the sequence $Y(k)$.
Note that given the time frequency duality properties of the DFT (and Fourier Transform in general) we can instead compute the circular correlation in frequency in the time domain using the same formulation as \ref{1} but changing time for freq:
$$\rho_{XY} = \text{FFT}\{(y x^*\} \tag{2} \label{2}$$
To be clear on the use of the above, if $x$ and $y$ were similar such that they would be correlated if they were perfectly aligned in time and frequency, then in the case that there was no time misalignment but a frequency offset existed (such as carrier offset error between transmitter and receiver in a wireless comm link), the above would determine that frequency offset by providing a function of correlation versus frequency. If there was both a frequency and time offset (as typically the case), then the correlation would need to be done in both dimensions, as I have demonstrated with FFT's here.
As a simple demonstration of the above, consider this example with a 11-chip barker sequence in the time domain as BPSK symbols (+1 or -1):
$$x[n] = [1,-1, 1, 1, -1, 1, 1, 1, -1, -1, -1]$$
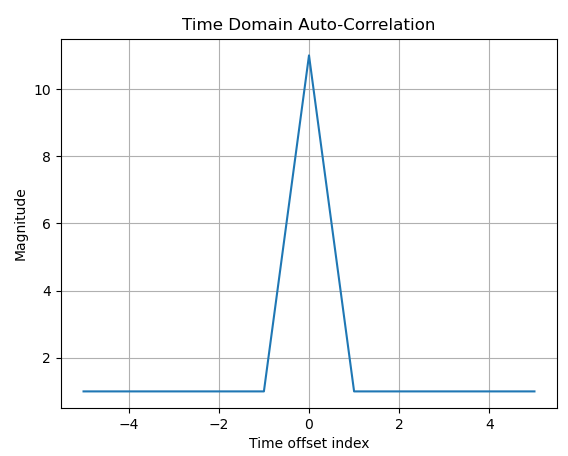
This sequence has a desirable time domain auto-correlation which is plotted below. When the sequence is aligned with itself in time, it's autocorrelation (as a sum of products) is maximum and equal to the length of the sequence (11). For all other values the magnitude will be 1 (since the sequence length is odd the sum of products can't be zero for any given shift). Given this property, it is useful for time domain resolution tasks such as synchronization and ranging.
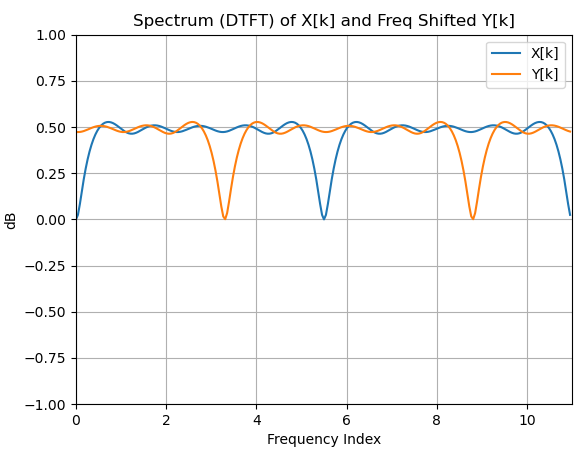
If there was a sufficient frequency offset in one of the sequences, then the correlation would be significantly degraded until the offset was corrected. For example, given a frequency index $k$ from 0 to 11 in the FFT (for the 11 sample sequence), I introduce a frequency offset of k_{offset} = 3.3 by a time domain product as follows:
$$y[n] = x[n] e^{j 2 \pi k_{offset} n/N}$$
A plot of the Discrete-Time Fourier Transform (DTFT) magnitude confirms the frequency translation that was introduced (note that I scaled the continuous frequency axis $\omega$ that extends from $0$ to $2\pi$ to show index $k$:
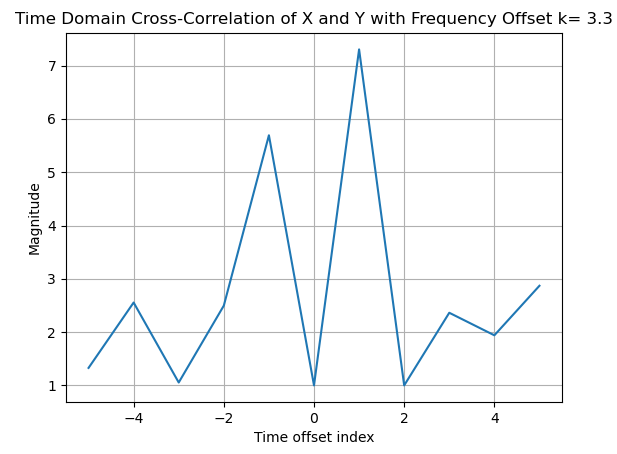
Below is an updated time domain cross-correlation, where we see that the frequency offset has destroyed the nice time domain correlation properties we desired:
Given in this set-up example we only have a frequency offset and not a time offset, we can use \ref{2} directly to determine the frequency (carrier) offset. Further, we can zero pad the FFT to resolve the fractional index frequency offset:
Below I show the result in Python using an FFT of the 11 sample product padded out to 256 samples:
rho_freq = fft.fft(y * np.conj(x), 256)
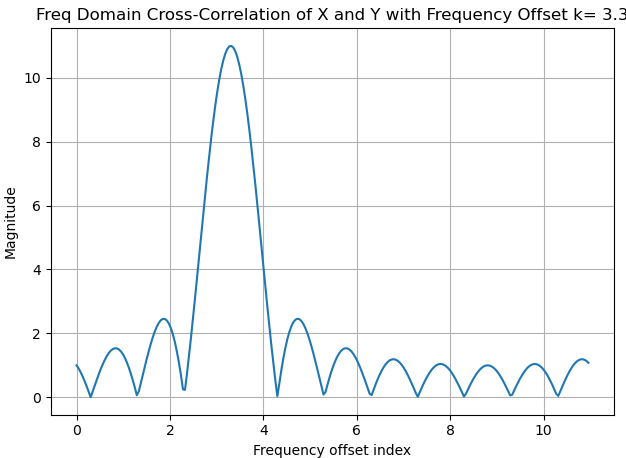
(Note that we could arbitrarily conjugate y instead of x, as in rho_freq = fft.fft(x * np.conj(y), 256). This would simply change which waveform is the reference and we would get a similar result but with a circular negative frequency shift instead of the positive one indicated in the plot above (the peak would be at k=11-3.3, instead of +3.3). This is simply a sign change and we just need to be aware of which convention we are using when accessing the result to determine the frequency error and applying the correction.)
From the above we can sufficiently resolve the frequency error, correct it by multiplying our time domain signal with the complex conjugate, and recover the nice time domain correlation that we desire:
$$x\hat[n] = y[n] e^{-j 2 \pi k_{offset} n/N}$$
A utility of this is correcting for carrier offsets in a communication link where transmitter and receiver are not yet synchronized: by using such codes in an acquisition header, we can get our initial estimates for carrier offset (as I showed here) as well as timing offset, which can then be maintained with carrier and timing loops that track these offsets as they change by monitoring the rest of the message using sample by sample tracking techniques.


