13
$\begingroup$

Uniform sampling can be thought of as multiplication of a function $x(t)$ with a Dirac comb function: $$\text{III}_T(t) = \sum_{k=-\infty}^{\infty}\delta(t-kT) \tag 1$$

Multiplication of $x(t)$ with $\text{III}_T(t)$ is equivalent to convolution with $\text{III}_{1/T}(f) $ in the Fourier domain, giving rise to copies of $X(f)$ spaced by $\Delta f = 1/T$ (the well known sampling theorem):

$$x(t) \cdot \text{III}_T(t) \xrightarrow{\mathcal{F}} \frac{1}{T} \sum_{k=-\infty}^{\infty} X(f-\frac{1}{T}k) \tag 2$$

Question: What is the frequency representation of a non-uniformly sampled $x(t)$? Or relatedly, what is the Fourier transform of a "non-uniform Dirac comb," assuming we know the time of each impulse?

The easy answer is that it is a sum of complex exponentials, but is there a way to simplify this, or see that it converges to a frequency domain Dirac comb as the time domain spacing approaches that of a uniform Dirac comb?

Many thanks for any insights!

Edit

Perhaps it helps to focus on the issue of aliasing. What is the spacing and weighting of spectral copies of $X(f)$ for non-uniform sampling, if any? For uniform sampling, we know that spectral copies are uniformly weighted and spaced by $1/T$ as described above.

@Fat32 suggests in the comments on his answer below that the copies are spaced evenly at $k\Omega_s/N$ (where $\Omega_s$ = Nyquist sampling rate), but have unusual weights. Can anyone confirm this, and give insight into the weights?

$\endgroup$
10
  • 1
    $\begingroup$ You gotta scaling issue with $T$ that you might wanna worry about. It's quite common and almost every electrical engineering text puts this $T$ in the passband gain of the reconstruction LPF, where it does not belong. $\endgroup$ Commented Jun 23, 2022 at 16:16
  • $\begingroup$ Could you elaborate Robert? Or do you have a link I could look at? Thanks for pointing that out. $\endgroup$
    – Gillespie
    Commented Jun 24, 2022 at 0:55
  • $\begingroup$ Sure. I wrote several answers here and have bitched for decades on comp.dsp about this issue, because nearly all EE DSP textbooks do it wrong. They're mathematically good because they put this scaler $T$ into the passband gain of the reconstruction low-pass filter. $\endgroup$ Commented Jun 25, 2022 at 23:47
  • 1
    $\begingroup$ The strict mathematical point is that you gotta multiply $x(t)$ with $T\cdot \mathrm{III}_T(t)$ to get $$\sum_{k=-\infty}^{\infty} X\big(f-\tfrac{k}{T} \big) $$ in the frequency domain. If you leave that leading $T$ off in the dirac comb function, then you get an additional factor of $\frac1T$ in the frequency domain and most textbooks deal with that with a $T$ in the passband gain of the reconstruction filter where it doesn't belong. $\endgroup$ Commented Jun 25, 2022 at 23:52
  • $\begingroup$ Now, if your non-uniform sampling was sorta uniform in it's non-uniformity, then this idea from Bob Adams shows that if you throw away one sample out of every $N$ samples, you can still get perfect reconstruction if your input $x(t)$ is bandlimited to a little lower than Nyquist: $$ X(f) = 0 \qquad \forall \ \ |f| \ge \frac{N-1}{N} \frac{1}{2T} $$ Remember $\frac{1}{T} = f_\mathrm{s}$ is the sampling frequency, so half of it is Nyquist. $\endgroup$ Commented Jun 26, 2022 at 0:01

5 Answers 5

8
+50
$\begingroup$

You might be interested in this particular reference paper:

  • Digital Spectra Of Non-Uniformly Sampled Signals : Theories and Applications is a somewhat obscure reference (from 1988! can't go wrong!) that gives a general representation of the spectrum of a special case of non-uniformly sampled digital signals: periodically non-uniform sampled signal. It's pretty convincing and a very interesting read, which I think answers part of your question.

Other references I found but didn't spend much time on:


EDIT: Adding details for the 1st reference

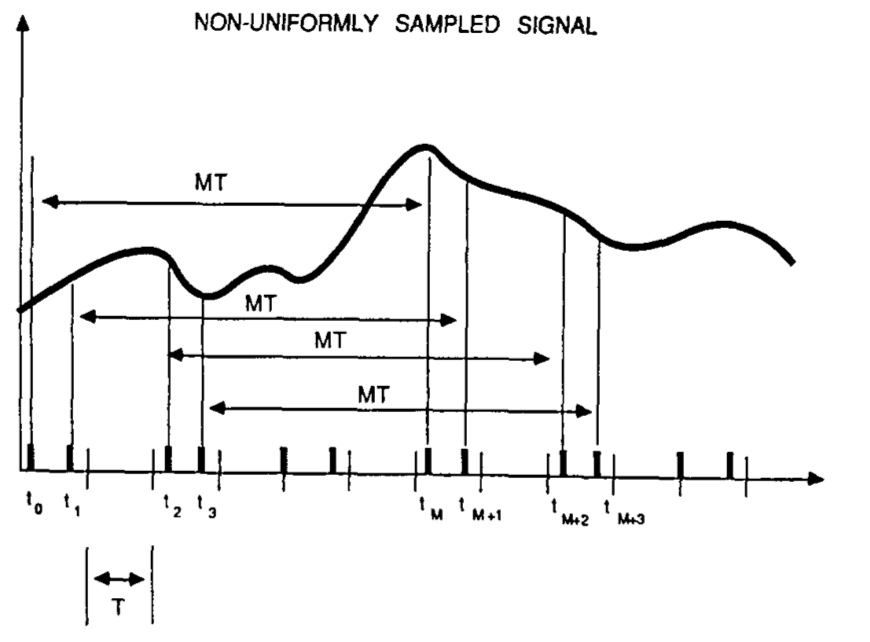
The paper deals with a special case of non-uniform sampling, Periodically nonuniform sampling, expanding on @Fats32’s answer regarding

sampling instants periodically repeated by blocks of $N$

Periodically nonuniform sampling

It starts with a signal $g(t)$, band-limited to ($-1/2T, 1/2T$), with Fourier transform $G^a(\omega)$:

The signal $g(t)$ is sampled in such a structured way that the sampling time instances [...] have an overall period $MT$.

It then defines another band-limited sequence, $\bar{g}(t)$:

The sampled data sequence is then treated as if it were obtained by sampling another function $\bar{g}(t)$, [...] at uniform rate $1/T$.

and states the aim of the paper (which answers your question, at least for these types of non-uniformly sampled signals):

We are interested in finding the representation of the digital spectrum of $\bar{g}(t)$ in terms of the Fourier transform $G^a(\omega)$ of $g(t)$.

Using the framework described above, it then goes through a really nice derivation of $G(\omega)$ to arrive at two representations, from which you can see the effect of the non-uniform sampling on the spectrum:

$$G(\omega) = \frac{1}{MT} \sum_{m=0}^{M-1}\left[\sum_{k=-\infty}^{\infty}G^a\left[\omega-k(\frac{2\pi}{MT})\right]e^{j[\omega-k(\frac{2\pi}{MT})]t_m}\right]e^{-jm\omega T} \tag{2}$$

And re-writing (2) with $t_m = mT - r_mT$, $r_m$ being the ratio of $mT - t_m$ to the average sampling period $T$ gives (4):

$$G(\omega) = \frac{1}{T}\sum_{k=-\infty}^{\infty}\left( \frac{1}{M}\sum_{m=0}^{M-1}e^{-j\left[\omega-k(\frac{2\pi}{MT})\right]r_mT}e^{-jkm(\frac{2\pi}{M})}\right)G^a\left[\omega-k(\frac{2\pi}{MT})\right] \tag{4}$$

$\endgroup$
13
  • 1
    $\begingroup$ May I suggest you to use links for papers that are more perennial and informative. For the first paper, a DOI could work: [dx.doi.org/10.1109/imtc.1988.10889](dx.doi.org/10.1109/imtc.1988.10889). There, one gets more bibliographic information, etc. $\endgroup$ Commented Aug 20, 2022 at 6:15
  • 1
    $\begingroup$ @Gillespie, I doubt you'll find a general closed-form representation of the spectrum of non-uniformly sampled signals, but I added a brief summary of the 1st reference that describes a particular sampling scheme: periodically non-uniform sampling. Hope this is somewhat what you were looking for! $\endgroup$
    – Jdip
    Commented Aug 20, 2022 at 15:21
  • 1
    $\begingroup$ @LaurentDuval done! Thanks! $\endgroup$
    – Jdip
    Commented Aug 20, 2022 at 15:25
  • 1
    $\begingroup$ @Jdip, I've submitted some minor edits to the equations. There was a missing $j$ in the first one, and missing division signs (by $MT$ and $M$) in the second which were hard to read, but I think I can see them in the paper, and confirmed they should be there by careful derivation. Also, I took the liberty of re-numbering the equations to the numbering they have in the paper (2 & 4). It's your answer, so feel free to revert if you prefer! $\endgroup$
    – Gillespie
    Commented Aug 20, 2022 at 20:25
  • 1
    $\begingroup$ The interesting thing would be to simulate these equations in MATLAB. I'll get to that eventually... $\endgroup$
    – Gillespie
    Commented Aug 23, 2022 at 21:53
2
$\begingroup$

For the simplest case of $N$ random samples of $x(t)$ taken over a duration of $T$ and satisfying the average Nyquist rate criterion, then the resulting Fourier transform of the non-uniform samples will be an $N$-fold aliased (as if $N$ times undersampled) and weighted sum of $X(\Omega)$.

This is an approximate statement which would be ideally true if the sampling instants periodically repeated by blocks of $N$, an ideal situation. If this is not so; i.e., random sampling instants never repeat or do not extend from minus to plus infinity, or if there's no analytic expression for the non-uniform sampling instants, then a closed form expression for the Fourier transform of the non-uniform samples may not exist. (I cannot say it won't, but I think it won't)

$\endgroup$
10
  • $\begingroup$ Thanks for the answer @Fat32. If the sampling is random, but we know where the samples were taken, can we say anything about how the aliasing occurs? Like where the wrapping point is for the ailaised copy of the spectrum for a given sample or something like that (if that even makes sense)? Also, what do you mean by "sampling instants periodically repeated by blocks of N"? Thanks again for your answer. $\endgroup$
    – Gillespie
    Commented Jun 23, 2022 at 4:00
  • $\begingroup$ @Gillespie yes that's the most typical scenerio. Aliasing will be similar to that of undersampling by N, but with special weights. Repeating is to make finite length samples go to infinity for mathematical convenience. $\endgroup$
    – Fat32
    Commented Jun 23, 2022 at 15:25
  • $\begingroup$ Correct me if I'm misunderstanding, but if taking N random samples produces N-fold aliasing, that would be similar (in some sense) to taking N/N = 1 sample, which doesn't make sense. I must be missing something. Can you illustrate what you're talking about? $\endgroup$
    – Gillespie
    Commented Jun 24, 2022 at 1:02
  • $\begingroup$ @Gillespie you are right in your misunderstanding because the term N-fold alising was very loose. What I wanted to say was that if the original Nyquist Sampling Rate is $\Omega_s$ then the aliased copies of $X(\Omega)$ will be shifted by $\Omega_s / N$ which would create N times overlapping copies to be added through the band $[0,\Omega_s]$ $\endgroup$
    – Fat32
    Commented Jun 24, 2022 at 1:37
  • 1
    $\begingroup$ @Gillespie No. They are centered at $k \Omega_s/N$ to right; that's why I miscoined the term N-fold alias :-) $\endgroup$
    – Fat32
    Commented Jun 24, 2022 at 3:01
2
$\begingroup$

If the samples are finite (e.g. not a running process) then you'd have to take the greatest common divider and resample all the vector, resulting in a "toothless" train of impulses.

For example, suppose the vector is $x=[1, 2, 1, 3]$ and it's sampled at $t=[0, 3, 5, 10]$. The time derivative will be $t'=[3, 2, 5]$, showing the step sizes. This means that the maximum sample size that would satisfy equisampling would be $T=1$, in which case the resulting vector will look like this: $y=[1, 0, 0, 2, 0, 1, 0, 0, 0, 0, 3]$. This is as "analytic" as you can get.

If $x$ is a live signal then the only thing you can do is to use chunks of the signal and perform an FFT on them as above, but any subsequent difference will mean that the first FFT will not be the same as any of the following chunks.

$\endgroup$
1
  • $\begingroup$ It looks like @Jdip's answer (+1) is the one you're looking for, but I still think it's a mission impossible given that you have missing possible information. E.g. in my example, between 1 and 2 there are two unknowns. Actually, I realize that I left it at a train of impulses, but it should be filled -- and that's the unknown, there's no information on how to fill. Will it be linear/cubic/spline/etc? Simply saying that the signal is band-limited is not enough. Filling with Dirac can be done in infinite ways in-between, bandwidth will be obeyed. $\endgroup$ Commented Aug 21, 2022 at 17:50
2
$\begingroup$

Matlab has the nufft which uses:

For a vector $X$ of length $n$, sample points $t$, and frequencies $f$, the nonuniform discrete Fourier transform of $X$ is defined as

$$Y(k)= \sum_{j=1}^{n} X(j)e^{−2\pi i t(j) f(k)}$$

where $k = 1, 2, \ldots, m$. When $t = 0, 1, \ldots, n-1$ and $f = (0, > 1, \ldots, n-1)/n$ (defaults for nufft), the formula is equivalent to the uniform discrete Fourier transform used by the fft function.

$\endgroup$
1
  • $\begingroup$ Thanks, Peter, I'm aware that the non-uniform DFT can be calculated, but I'm more interested in the principle behind non-uniform sampling. For example, aliasing manifests differently for non-uniform sampling. Rather than perfect replicas that overlap and sum in the frequency domain (as in uniform sampling), you get some kind of mishmash with non-uniform sampling that it seems like we should be able to describe mathematically. $\endgroup$
    – Gillespie
    Commented Aug 19, 2022 at 14:40
1
$\begingroup$

There's some analog non-uniform sampling theory and before microchips took over signal processing there were analog systems around to obtain the spectrum of non-uniformly sampled signals.

Analog signal processing is still active in some applications, actually this IET recent event mentions a shy revival of analog processing.

But the point is, it all ends up being processed with a CPU or GPU and unless you are doing Quantum processing research or developing a new analog processing computer, you have to work with one discrete sequence of numbers.

It's far more practical and common practice to 1st 'resample' the signal into a regular time interval dt and then apply for instance FFT.

1.- Import the signal and time reference into MATLAB

2.- Try this

https://uk.mathworks.com/help/signal/ug/resampling-nonuniformly-sampled-signals.html?s_tid=srchtitle_non-uniform%20sampling_1

3.- Unless the signal has really dispare time intervals, like a cluster of many samples pretty close each other with really low dt, followed by eons of time to next cluster, then it may be the case that some interpolation sufices to turn it into a quite 'regular' time interval signal.

You can do different 'resamplings' and measure coherence among obtained spectrums.

4.- If you supply the signal or a significant chunk of it I may be able to further help with MATLAB, free of charge, I like solving problems with MATLAB.

Awaiting answer

$\endgroup$
1
  • 2
    $\begingroup$ Thanks for the answer John. Perhaps I wasn't quite clear in my question, but I'm more interested in the precise mathematical effects of nonuniform sampling. I know you can resample to a uniform grid, but this process leaves artifacts unless you try to account for them. $\endgroup$
    – Gillespie
    Commented Aug 23, 2022 at 15:51

Your Answer

By clicking “Post Your Answer”, you agree to our terms of service and acknowledge you have read our privacy policy.

Not the answer you're looking for? Browse other questions tagged or ask your own question.