This is a common homework or quiz/test problem so I won’t bypass the learning experience by providing the full solution, but I will provide further details that will give intuitive insight into the conditions in which the FM and AM sideband levels for a sinusoidal modulation will be the same and how the modulation index for FM relates to the sideband level.
This is not applicable to general AM and FM modulations, so I will first clarify what types of AM and FM modulations are being considered, and then show the very intuitive way to see what the modulation index would be for the sideband levels to be the same.
To be clear, the AM referenced by the OP is specifically "Large Carrier AM Modulation" where the sidebands are significantly lower than the carrier which is not suppressed (in contrast to suppressed carrier AM modulations where the carrier is completely removed).
And for the FM case, the FM referenced by the OP is specifically "Narrowband FM Modulation". Narrowband FM Modulation is when the modulation index (which is the peak angle of the carrier as modulated by a sinusoidal modulation) is small enough such that there are only one pair of significant sidebands on the carrier, spaced at the modulation rate similar to the Large Carrier AM Modulation.
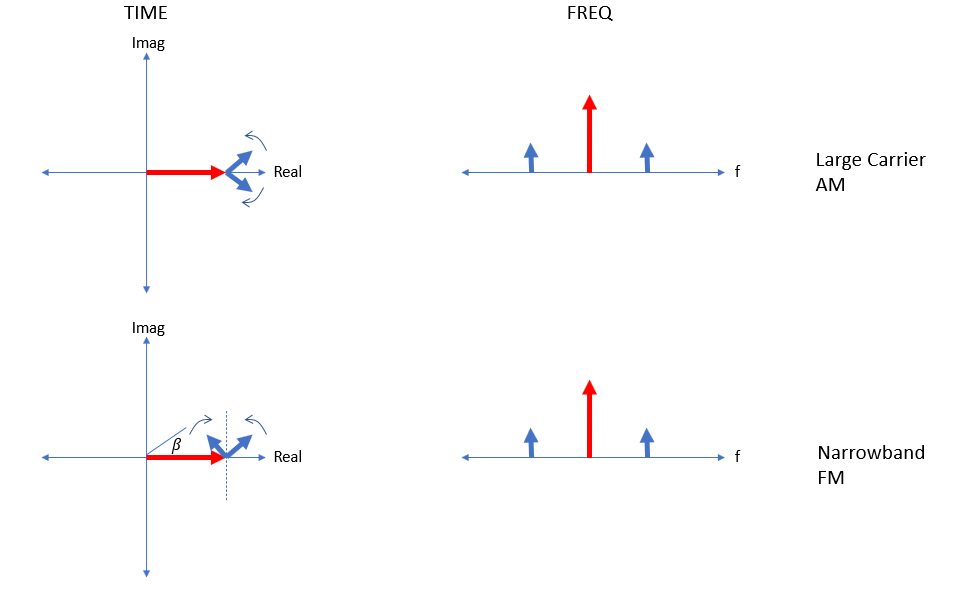
That said, observe the plots below comparing phasor diagrams in time for both cases with the resulting magnitude spectrums in frequency:

Large Carrier AM:
A normalized 1 KHz sinusoid in time has a Fourier Transform that results in two impulses at $\pm 1$ KHz each with a magnitude of $1/2$ consistent with Euler's formula:
$$\cos(2\pi 1000t) = \frac{1}{2}e^{j2\pi 1000 t} + \frac{1}{2}e^{-j2\pi 1000t}$$
From this we should get our first "Aha!" that each $e^{j\omega t}$ term is a spinning phasor in time time domain since $Ke^{j\theta}$ is the same as $K\angle\theta$. The Fourier Transform is just the magnitude and initial phase for each spinning phasor.
So for the AM case, the blue phasors shown are these components of the sinusoidal modulation, that when applied to Large Carrier AM as a modulation signal, end up adding to the carrier phasor in phase. The above diagrams are the "baseband equivalent" of the modulated signal such that we can "freeze" the carrier as shown (consider if we had a strobe light on it flashing at the carrier frequency), such that we see just the sidebands rotating relative to the carrier. With the carrier added to the sidebands in phase, the net result will always be on the real axis, resulting in a change in the amplitude only (the phase will always be zero). In this case after summing everything we would see in the time domain on the complex plot shown, that the resulting phasor would go stay on the real axis and change in amplitude sinusoidally but due to being Large Carrier AM (small sidebands) the amplitude will always stay positive. If you can visualize all that, then the FM case will make complete sense.
Narrow Band FM:
With narrow band FM the difference is the two phasors from the sinusoidal modulation are added in quadrature, as shown in the lower part of the diagram.
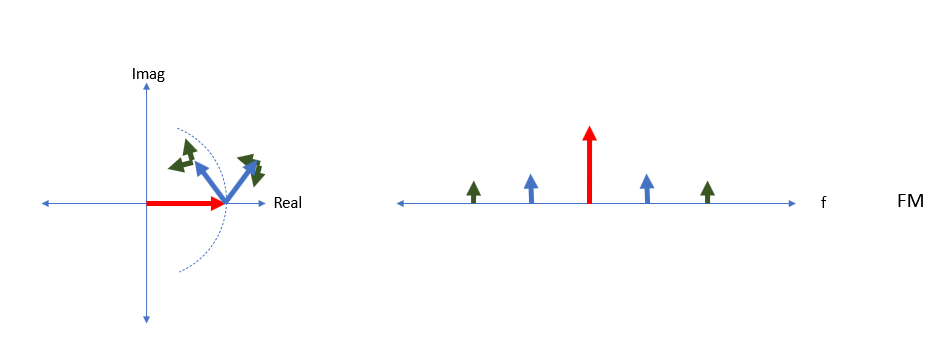
With FM in general with the carrier depicted as a phasor, we would see the carrier phase change only and always remain at a constant amplitude (frequency is the derivative of phase, so if the phase is changing sinusoidally, the frequency is also changing sinusoidally). So we would see the phasor changing its phase only, sinusoidally and thus staying on a constant radius. We note that the sum of the carrier with the two sidebands if the sidebands are large, will deviate from a constant radius (AM will be induced if there are only two sidebands if the sidebands are large enough). But if the sidebands are small (resulting in a small angle), the deviation in amplitude will be insignificant, and this is the condition for Narrowband FM.
Under this case specifically there will only be one pair of significant sidebands, consistent with the drawings given above. Due to small angle approximations ($\sin(\theta) \approx \theta$) we can see that the magnitude for each of the phasors (which we saw is directly related to their magnitude in the frequency domain) will be directly related to the peak angle (when the two phasors both sum in quadrature to the carrier, their sum will be equal to the peak angle $\beta$ if we normalized the carrier). For FM modulation that peak angle $\beta$ IS the modulation index! So from this we see the relationship between the modulation index and the sideband level for Narrowband FM, and we see the equivalence to Large Carrier AM.
Note that for general FM with large angles, many sidebands are needed such that when they all add together the sum will stay on the constant radius circle as depicted in the graphic below. In this case the carrier phasor and all the sideband phasors necessary to stay on the constant radius circle are predicted with Bessel functions.


