1
$\begingroup$

I want to plot the FFT of a sine wave using matplotlib and I want to plot a single line at a frequency where the sine wave belongs.

here's my code

import numpy as np
import matplotlib.pyplot as plt


f = 3
t = np.arange(-np.pi, np.pi, 0.01)
y = np.sin(2*np.pi*f*t)


plt.subplot(2, 1, 1)
plt.plot(t, y)


ft = np.fft.fft(y)

plt.subplot(2, 1, 2)
plt.plot(ft.real)

plt.show()

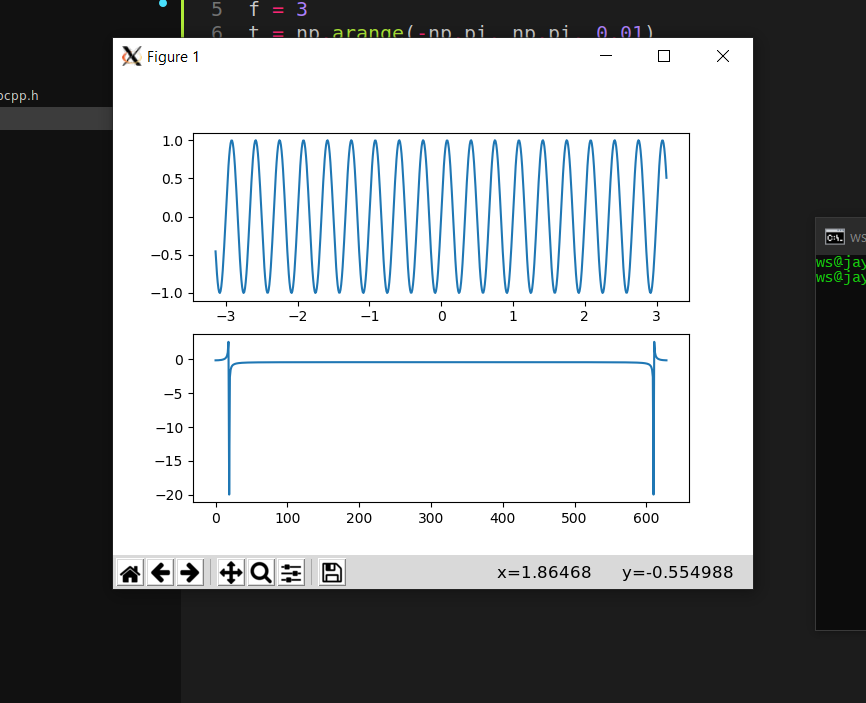
And, here's the output of the above code.

FFT

I want to plot the FFT as a single line, and this single line will be straight up at the given sine wave's frequency. Suppose, if I have two sine waves of 20Hz and 40Hz added together like sine(2*pi*20*t) + sine(2*pi*40*t) then their FFT should have two straight lines at 20Hz and 30Hz.

How do I fix my code to get what I wanted? I've seen many questions here on StackOverflow but I did not understand them. Any help would be appreciated.

$\endgroup$
1
  • $\begingroup$ You need to plot the absolute value of the FFT, not the real part $\endgroup$ Commented Feb 4, 2022 at 11:39

1 Answer 1

2
$\begingroup$

You have two peaks because it is the right result. The Fourier transform decomposes a signal with a series of complex exponential function rather than (real) sinusoidal function. A single frequency sine wave can be written in the form of $$ \sin(\omega_0t) = \frac{\exp(j\omega_0t)-\exp(-j\omega_0t)}{2j} $$ Hence the two peaks represent the magnitudes at positive frequency $\omega_0$ and negative frequency $-\omega_0$, respectively. If you only need the positive frequency components, just discard the negative results as

ft = np.fft.fft(y)[:nfft//2]

where nfft is the FFT size which is equal to length of y if not specified.

$\endgroup$
1
  • $\begingroup$ that makes sense, thank you! $\endgroup$ Commented Feb 5, 2022 at 9:26

Your Answer

By clicking “Post Your Answer”, you agree to our terms of service and acknowledge you have read our privacy policy.

Not the answer you're looking for? Browse other questions tagged or ask your own question.