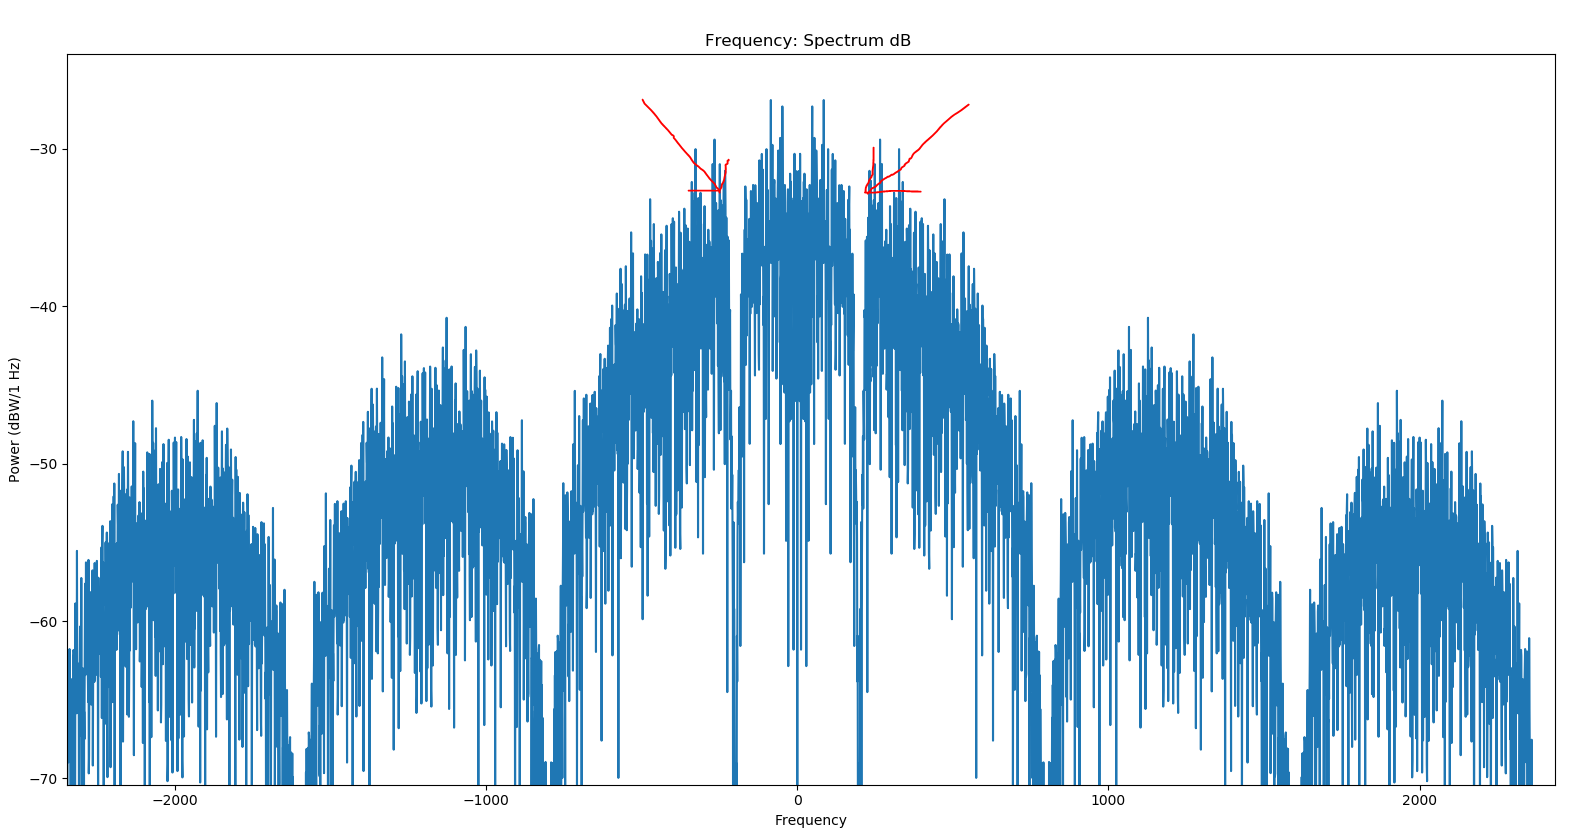
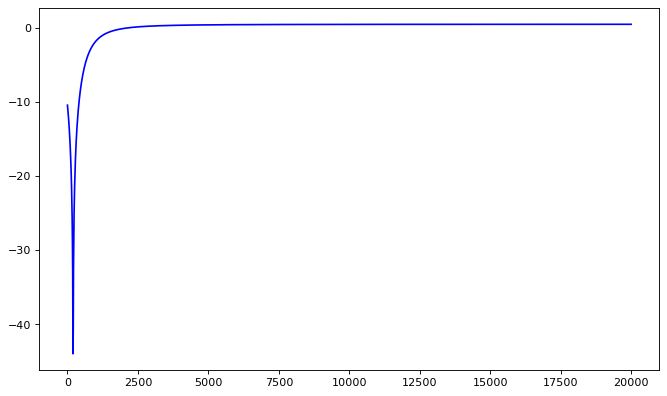
I have posted a summary of what I am seeing, I just made a pulse train and testing a notch filter on it as an example only.
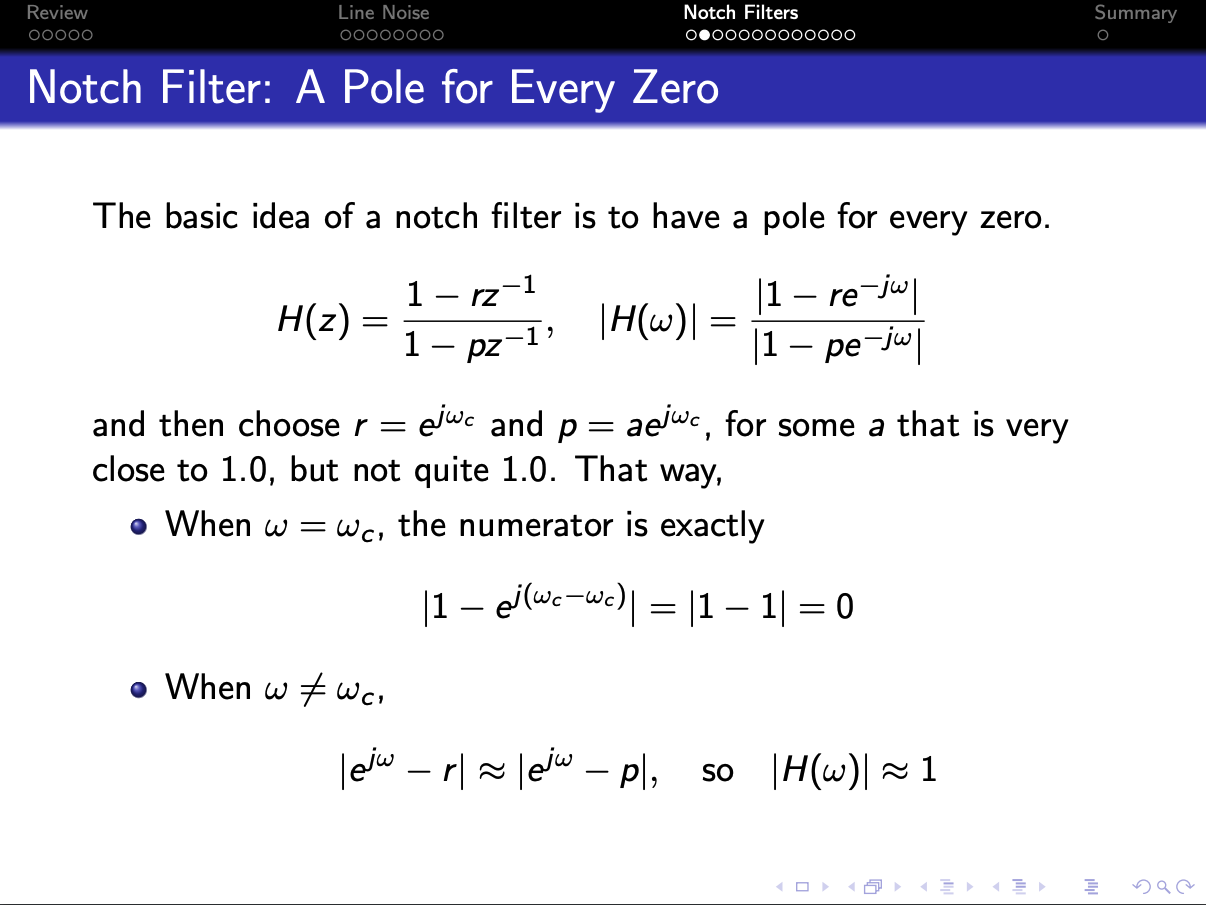
I also have a complex baseband signal centered on 0 Hz, this complex baseband signal has a complex exponential in it that is only on the positive frequency - this is an interference I need to remove - hence a notch filter to only remove a positive frequency. I cant post this code here because there is too much so i posted a pulse train and a notch filter instead.
My notch filter is applied on both the positive and negative frequency. I cannot see why using iirfilter and lfilter in scipy is not doing it correctly on a complex signal. It applies the notch on the positive and negative frequencies instead of just one.
What am I missing here? Any advice appreciated!
import numpy as np
import matplotlib.pyplot as plt
from scipy import signal

plt.close('all')

#Sampling
Fs = 40e3 # samples per second
Ts = 1/Fs
Ns = int(Fs)            #if =FS then resolution = 1
t = np.arange(Ns) * Ts # time vector for carrier
fftsize = Ns #Full length FFT
resolution = Fs / fftsize
f = np.arange(-Fs/2, Fs/2,resolution)


#Pulses
pulse_span = 50
pulse_duration = pulse_span*Ts
data = np.random.randint(0,2,int(Ns/pulse_span))
data = (data - 0.5)

x = np.zeros((Ns))
for i in range(len(data)):

    increment_low = i*pulse_span
    increment_high = increment_low + pulse_span
    x[increment_low:increment_high] = data[i]


#Filter Function
def Implement_Notch_Filter(time, band, freq, ripple, order, filter_type, data):
    from scipy.signal import iirfilter
    fs   = 1/time
    nyq  = fs/2.0
    low  = freq - band/2.0
    high = freq + band/2.0
    low  = low/nyq
    high = high/nyq
    b, a = signal.iirfilter(order, [low, high], rp=ripple, btype='bandstop',
                     analog=False, ftype=filter_type)
    filtered_data = signal.lfilter(b, a, data)
    return filtered_data
x = Implement_Notch_Filter(1/Fs,50,200,0.5,2,'butter',x)


#Spectrum
X = np.fft.fft(x,fftsize)/fftsize
X = np.fft.fftshift(X)
X = abs(X)
X_PSD = 10*np.log10(              abs((X))               **2)


fig = plt.figure(2)
ax = fig.add_subplot(111)
ax.title.set_text('Frequency: Spectrum dB ')
ax.plot(f,X_PSD)
plt.ylabel('Power (dBW/' + str(int(resolution)) + ' Hz)')
plt.xlabel('Frequency')
plt.ylim([-80, -20 ])


