tl;dr: ADC noise is both distributed (approximated white noise) and spurious. A N-point FFT is a bank of N filters each approximating a Sinc function in frequency with an equivalent BW of 1 bin. The power output of each FFT bin is proportional to the total power across that filter's BW. For the case of white noise, as the BW gets bigger, the power out in each bin goes up--- this is the FFT noise floor. Spurs, unlike white noise, are not a distribution and therefore do not go up and down as we change the BW of the filter (assuming the filter is centered on the spur). In order to have enough dynamic range in the FFT to see the spurs, we need to ensure the filter BW is narrow enough so that the total integrated white noise power in the filter is less than the total power from the spur.
More Details:
Quantization noise can be well approximated (modeled) as uniform white noise, meaning the distribution of the amplitude is uniform (with an uncorrelated input waveform and sufficient number of bits, it is equally likely that "truth" is anywhere between the quantization levels at each sampling interval), and the distribution of the energy in frequency is also uniform (white) over the sampled spectrum from $-f_s/2$ to $+f_s/2$. In practical implementation due to correlation with the test signal, and non-linearities in the ADC, will result in individual frequency tones in the ADC output called spurs. Thus both Spurious Free Dynamic Range (SFDR) and Signal-to Noise and Distortion (SINAD) are specified (among other ADC performance metrics).
The SFDR is the rms level of the strongest sinusoidal input that maximizes the SFDR (typically this level is around 1 dB below where the actual full-scale is) relative to the level of the maximum spur rms level.
Signal to Noise and Distortion (SINAD) is typically used to denote the rms level of the Signal relative to ALL noise contributions (meaning all the spurs, all the quantization noise, etc), again at a Signal level for a sinusoidal test tone that would maximize this metric. DC offset is usually not included. Since SINAD includes all spurs, including the strongest one, SINAD will always be less than SFDR; however SINAD represents ALL the noise power in the digital spectrum, where SFDR represents a tone at one specific frequency.
After I will show how the formula for SINAD = 6dB/bit + 1.76 dB is derived which will give further insight, but first to answer your question: A key point is that the noise component of SINAD is both at individual frequency locations as spurs and also as distributed noise. Together they are the total noise in SINAD. An FFT is a bank of filters, each filter separated by $F_s/N$ where $F_s$ is the sampling rate and N is the number of bins. (This is very clear if you do a sliding FFT across a waveform, recomputing a new FFT output after each sample shift such that a waveform is produced at each bin). Further, without modifying the time domain data with windowing or zero padding, each bin has a bandwidth of 1/T where T is the duration in seconds of the time domain block being FFT'd. So there is a filter for each bin and each filter is equivalently 1 bin wide. Also note that as the number of samples in the FFT increases, the shape of each filter in frequency approaches a Sinc function (which isn't a great filter, meaning each FFT output will be sensitive to frequencies in other bins).
This is demonstrated with the simple case of a 4 point FFT in the figure below, where we see 4 filter responses, one for each of the 4 FFT outputs. The output of each "filter" will be proportional to the total integrated power across the spectrum after being filtered in each bin; thus in this example we see how a single tone shows up in all the bins, based on each bin's respective attenuation at the particular frequency the test tone is at. However each bin has an equivalent noise band width of 1 bin which is equal to $1/T$ as I described earlier. This means that if the input was white noise, an equivalent brickwall filter with bandwidth $1/T$ would have the same total noise power at the output of the filter. So for the case below, with a white noise input, each of the four FFT outputs would have a noise power term that is 1/4 of the total noise. (If we did successive 4 point FFT's from a larger data set, either block by block or a "moving" FFT where we slide over the sample set one sample at a time, it would be very clear by observing the outputs that their rms level would each be 1/4 of the input rms level, assuming a white noise input).
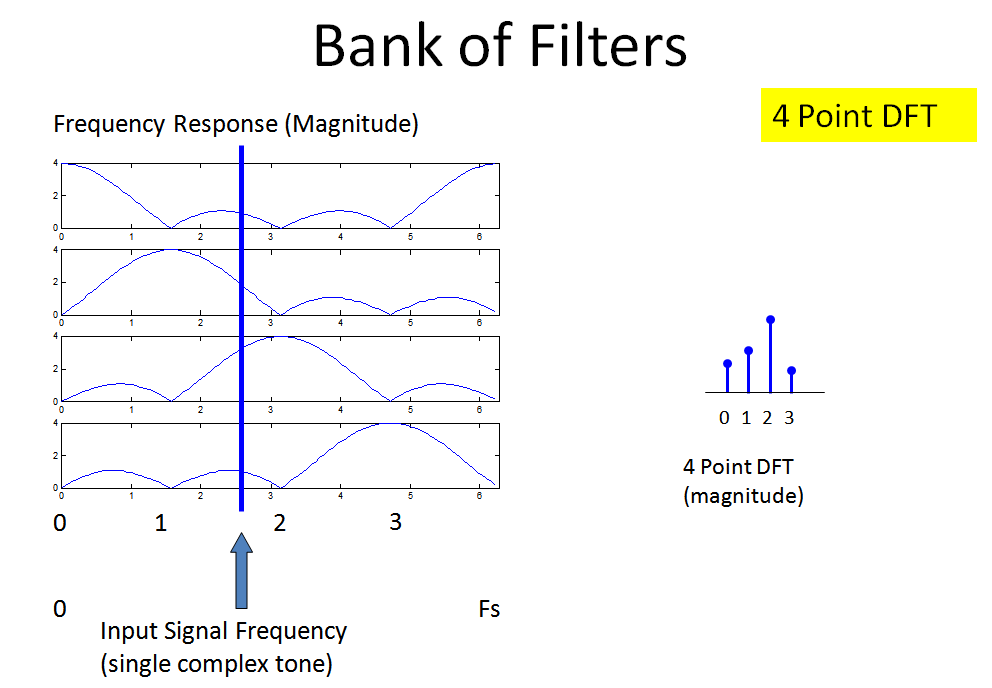
Every time we double the number of points in the FFT, each filter reduces in BW by half, so for white or similarly distributed noise, the power would reduce by $10log(2)$ = 3 dB. The power level for a spurious signal which exists at one frequency (and is not a power distribution) would not change. Therefore in order to see a spurious signal, we need to ensure we have enough resolution (narrow bandwidth filters) so that the total distributed noise power in the bandwidth of each bin is less than the noise power of the spur.
Why 6 dB/bit + 1.76 dB?
In the plot below I show the SNR for a "perfect" A/D Converter with a noise distribution due to quantization noise modeled as a uniform distribution (noise that is uniform in amplitude over a height of one least-significant bit). Since this noise is due to quantization noise alone, it is also called SQNR (Signal to Quanitization Noise Ratio).
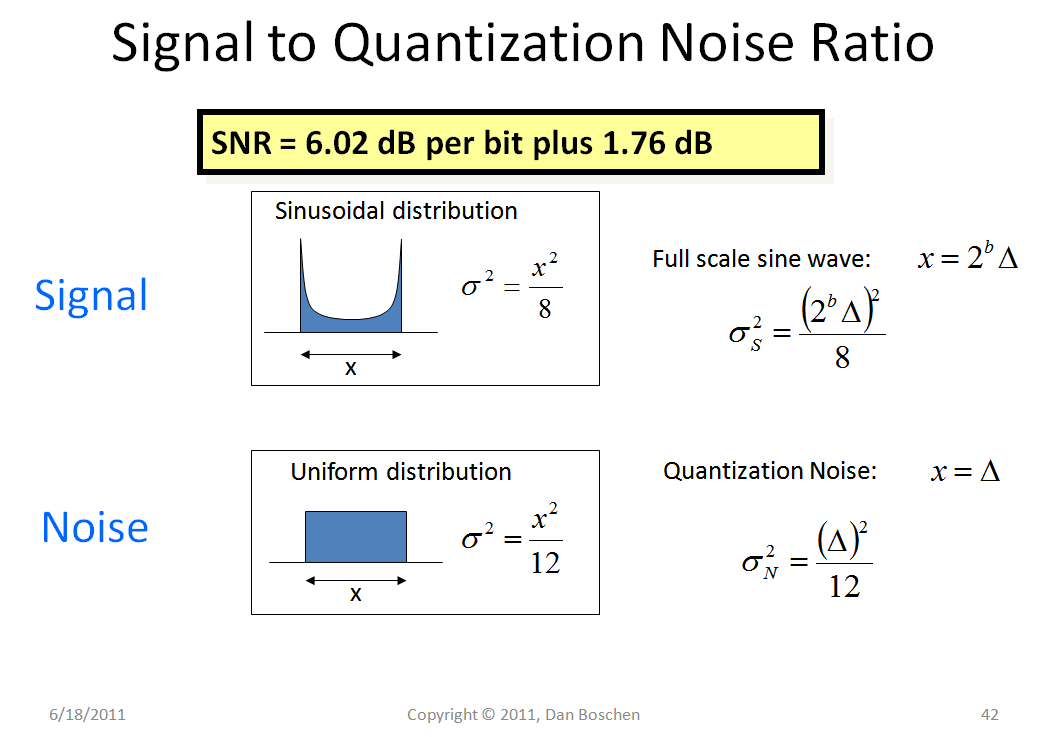
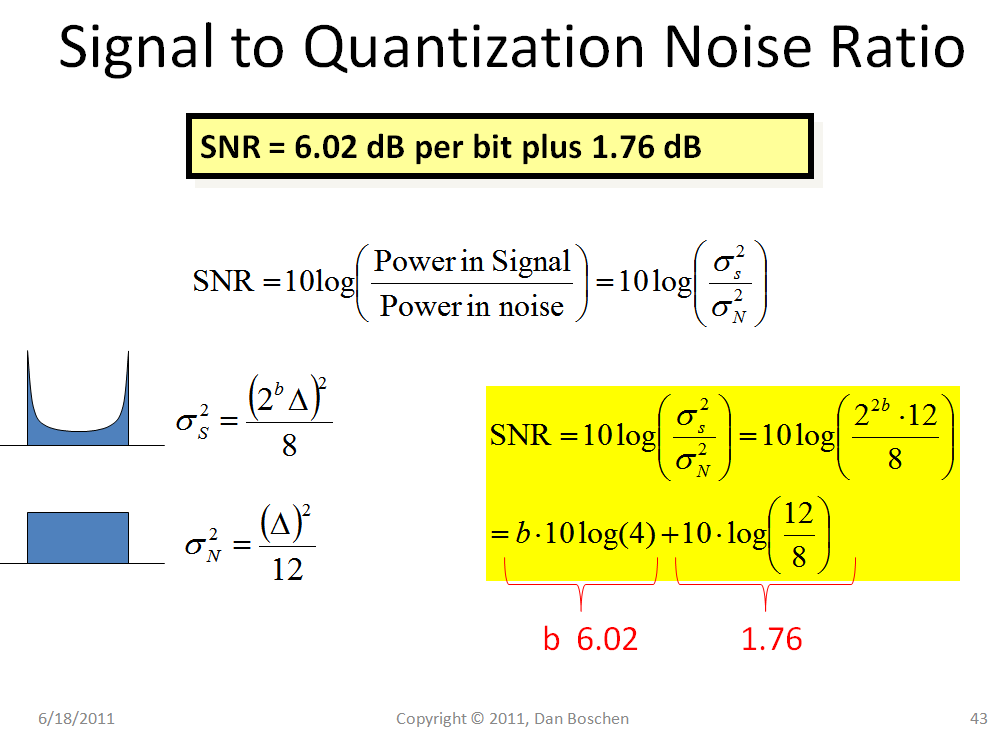
The first plot shows the distribution (histogram) for a full scale Sine Wave, along with the variance for such a distribution. This is compared to the variance for the uniformly distributed quantization noise. As the next slide slows, it is the ratio of these two distributions (Signal - Quantization Noise) that results in the handy relationship between number of bits and SQNR, importantly for a full scale sine wave:
SQNR = 6 dB / bit + 1.76 dB.
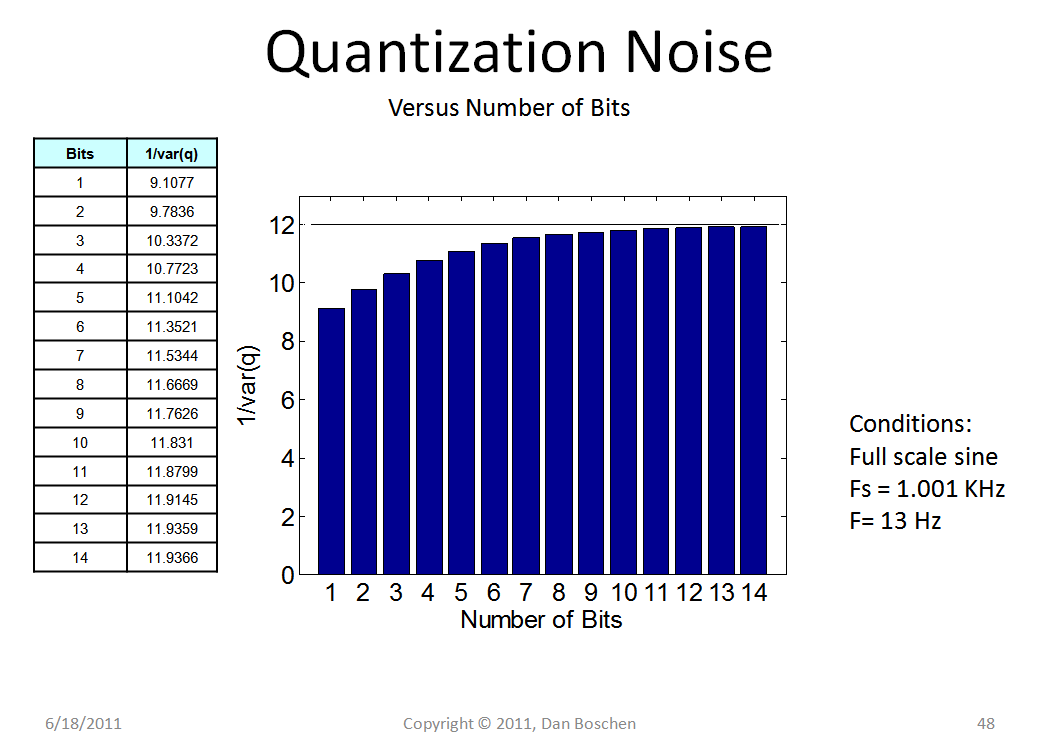
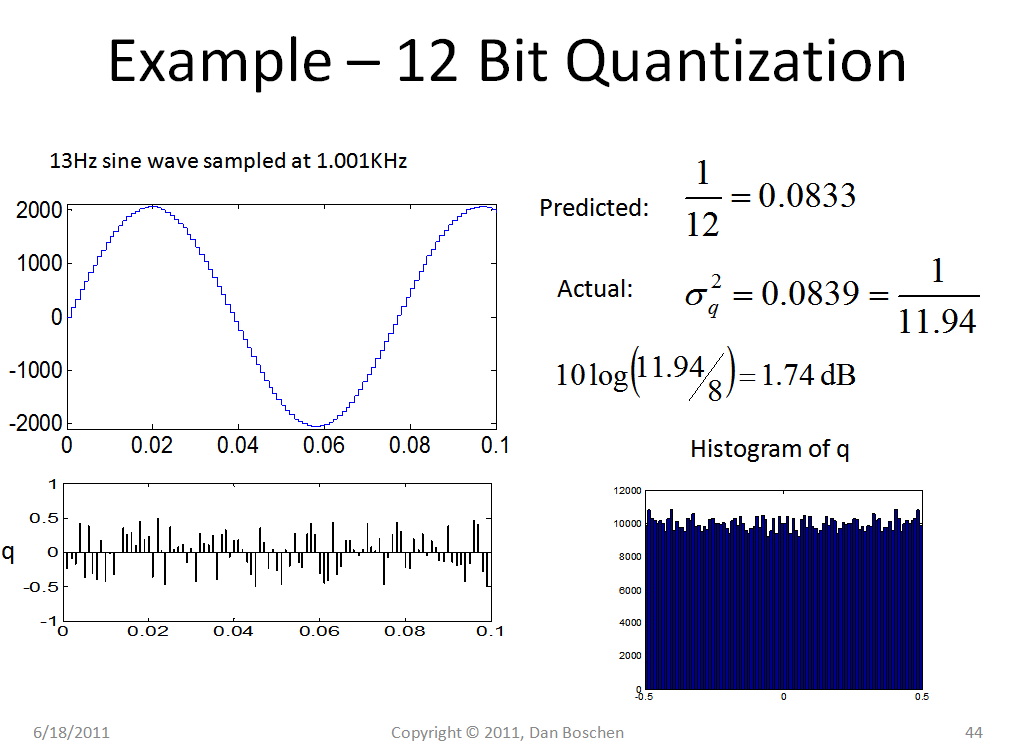
I had actually completed and experiment to see how well this approximation would hold up for lower number of bits with the results graphed below, showing little error with the predicted result over a wide range of number of ibts (7 bits results in 1/11.53 instead of 1/12 which would result in an error in the calculated SNQR of only 0.17 dB.)
Further it is interesting to see that with a large number of bits, the histogram is uniformly distributed as expected, and the quantization noise is fairly "scrambled" relative to the input signal and from sample to sample; resulting in a reasonably white spectral density in frequency (unfortunately frequency plot is not shown).
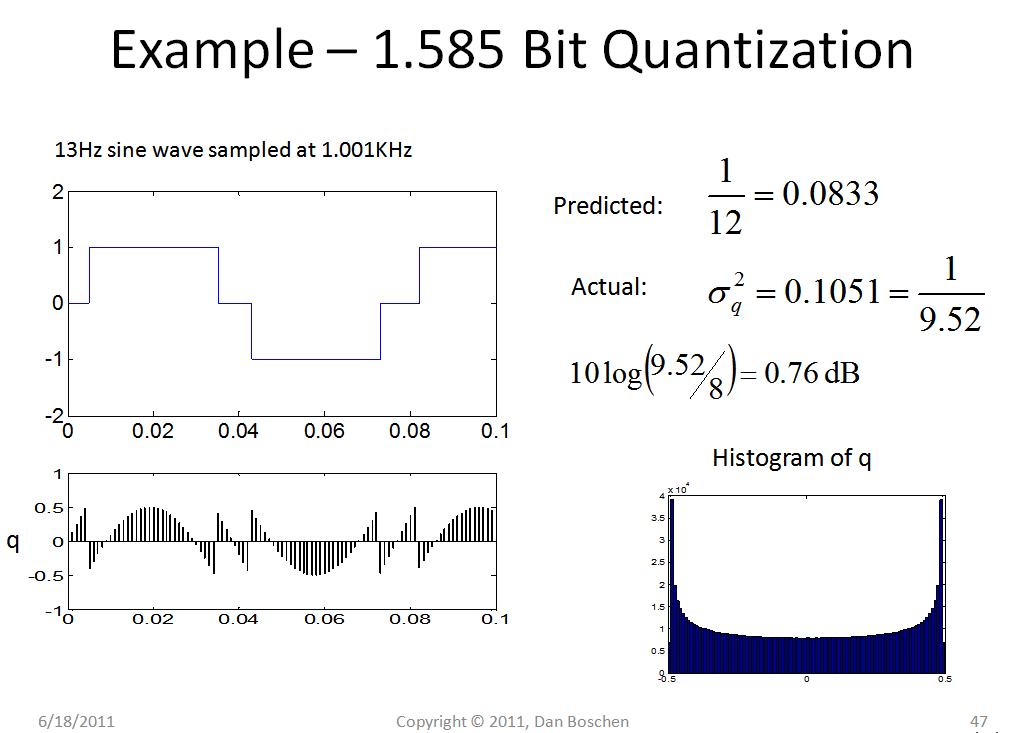
In comparison, here is a plot at the other extreme with a 1.585 bit converter. Notice that the histogram approaches that of the input signal (the sinusoid), explaining why the early plot showing the variance for quantization noise at different number of bits approaches 1/8 as the number of bits is reduces (approaching that of the input signal!). Also note the pattern of the quantization noise itself plotted below the signal (showing the error from "truth" to the levels available). Here we see clear correlation both with the input signal and from sample to sample; this means very strong spurs will be present!
The above cases were for a modeled "perfect" A/D converter; more specifically a quantized digital signal. In actual ADC implementation, there will be other analog distortion sources and non-linearities that will also contribute to noise. This gives rise to Effective Number of Bits (ENOB). ENOB converts the actual A/D Converter into an equivalent "perfect" A/D converter: specifically an equality is made between the actual measured or expected Signal to Noise ratio from all noise sources (SINAD) and SNQR which implies quantization is the only noise source, and by solving for the number of bits in SNQRthat would be equal to SINAD (from 6dB/bit + 1.76 dB as the OP had done) , we determine the equivalent "perfect" A/D converter that would result in the same total noise level. Because the noise is both distributed and spurious, it is important to consider both ENOB (or SINAD, they are both derived from the same result) and SFDR.
Here is also a good reference from Analog Devices that gives further details:
https://www.researchgate.net/file.PostFileLoader.html?id=58871498404854e3dc2f909f&assetKey=AS%3A453975662174208%401485247640061


