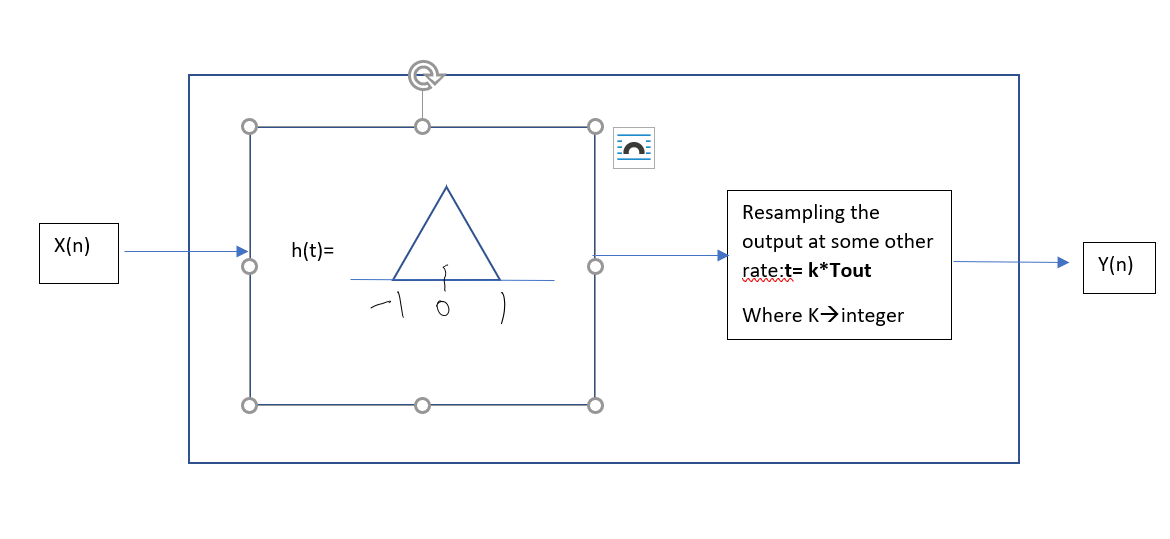
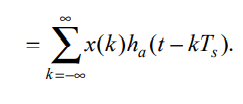
Yes it is possible to come up with the frequency response through a resampling process.
Resampling is typically done with a zero-insert which creates periodicity in frequency, so the resulting spectrum from the first linear interpolation prior to the zero-insert is simply replicated in frequency. This is then followed by the frequency response of whatever upsampling filter is used for final interpolation.
Further, the frequency response of the linear interpolator is not $sinc(f))^2 $ but an aliased version of this given the system is sampled to compute the interpolation. The frequency response for that first part of the process outlined can be found from the z-transform of the linear interpolation function as follows showing an example of a 2 sample linear interpolation:
Linear interpolation:
$$y[n] = \alpha x[n] + (1-\alpha) x[n-1]$$
Z-transform:
$$Y(z) = \alpha X(z) + (1 - \alpha) X(z) z^{-1}$$
Resulting in the following transfer function:
$$H(z) - \alpha + (1- \alpha)z^{-1}$$
And the frequency response is when $z = e^{j\omega}$:
$$H(e^{j\omega}) - \alpha + (1-\alpha)e^{-j\omega}$$
For example if $\alpha = 0.2$ the transfer function of this would look like the following plot showing the response from DC to the sampling rate (normalized radian frequency of $0$ to $2\pi$:
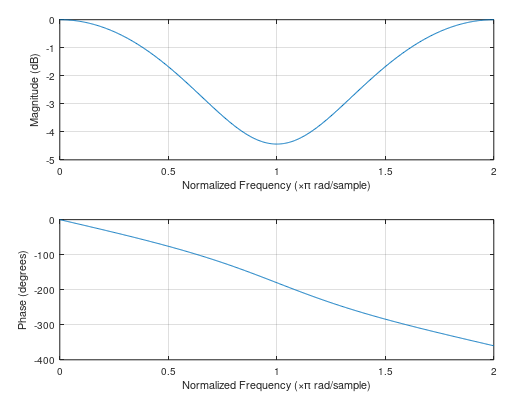
After the zero-insert from the first step of doing interpolation, the resulting spectrum after the interpolator is replicated by $I$ where $I$ is the interpolation factor (with $I-1$ zeros inserted). For example, if we inserted 3 zeros between every sample to interpolate by four the resulting spectrum from the above interpolation filter response would then look like the following (do not confuse the upper regions with a "frequency response" from the input since these would be replicated of whatever what in the first copy:
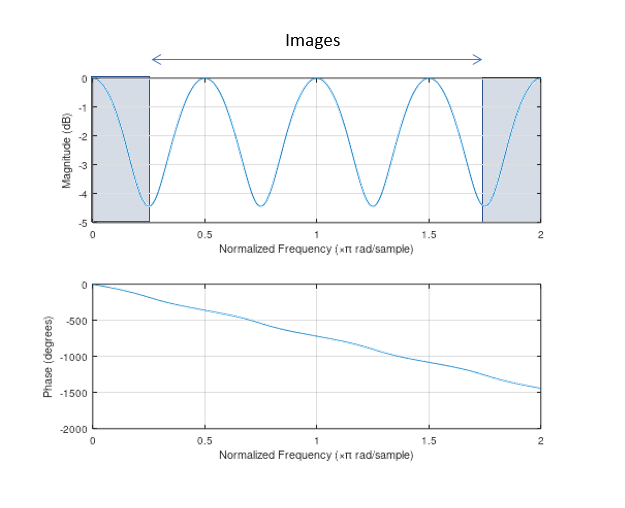
The shaded areas provide the actual and accurate frequency response from the input through the zero-insert process over that band of frequencies. The upper portions outside of the shaded area would give us an indication of the distortion due to images since the spectrum is duplicated, but this does not preclude us from determining a frequency response overall from input to output specifically in the frequency of concern related to the original digital sampling spectrum prior to upsampling. Assuming a proper interpolation design, the replicated spectrum would be filtered out by a final interpolation filter such that the distortion from replication is sufficiently eliminated. We are then left with the frequency response of cascading the response derived above with the response of the interpolation filter.
Further any concern with a frequency response from the upper frequency zones must rather consider the anti-alias filter ahead of the digitizer, which if not designed properly would also result in aliases from those zones to the shaded zone of interest. Assuming proper anti-alias filtering there, and proper interpolation filtering after the zero-insert, we can come up with a practical and accurate frequency response for the shaded zone of interest (which would be the only frequencies to pass through in a properly designed interpolator).
For example, if we did the final interpolation filter with a 4 sample moving average (to show the case of insufficient distortion elimination), the frequency response is given as follows:
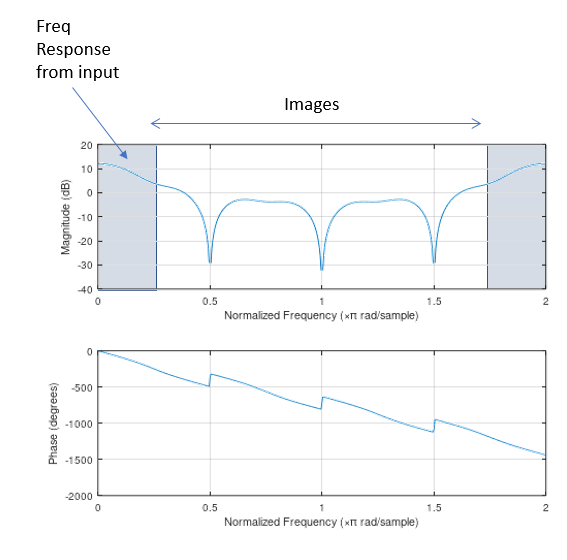
Thus the actual response can be determined combined with an indication of the distortion in the replicated zones. The process to doing this is to add the zero inserts into the response from the linear interpolation transfer function, and then convolve this response with the subsequent interpolation filter that would be performed after the zero insert. So specifically for above, I convolved the coefficients $[\alpha, (1-\alpha)]$ with the coefficients of a four sample moving average $[1, 1, 1, 1]$.
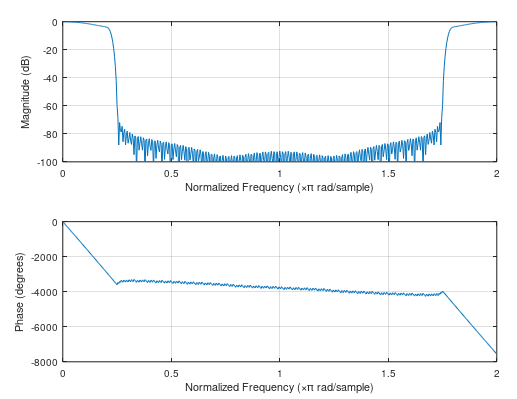
I used a simple moving average to demonstrate the resulting image locations, but with a better final interpolation filter (to get rid of those images) the final response would appear similar to that shown below, as as given above the frequency response as measured from the input through the whole system would be in the normalized radian frequency range of $0$ to $\pi/4$ similar to the shaded regions marked above:
