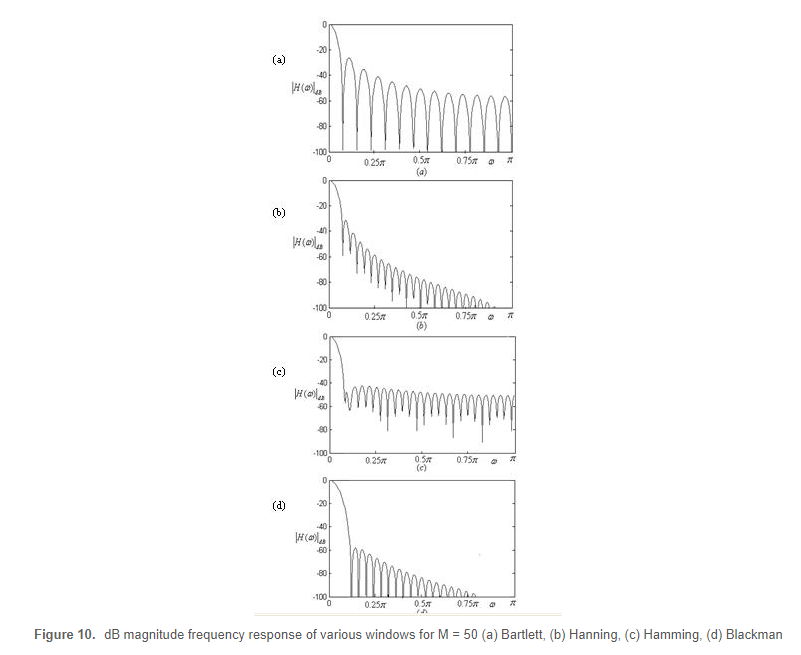
I was reading this and it explains the various windows such as Rectangular, Bartlett, Hanning, Hamming, and Blackman. Specifically, I saw this graph comparison of their dB magnitude frequency response for M=50. 
Obviously, there are differences between the techniques. However, as a newbie in the subject, I can't quite put it into words. I know it involves their passband ripple, stopband attenuation, and transition regions, but further than that I can't put out into words what are the differences of these window techniques in terms of the parameters mentioned above.
[EDIT] I need the appropriate technical adjectives for the parameters. For example, am I right in saying that the passband ripple gets larger from (a) to (d) because the magnitude gets steeper at the start of the graph from the left? And for the stopband attenuation, it gets smaller from (a) to (d) because the magnitude of the bounce as it gets to the right of the graph gets smaller? For the transition regions, it gets smaller and the transition gets finer (?) from (a) to (d) since the width of the bounces gets smaller?
[EDIT] The words I use doesn't seem right, or not that appropriate. I feel like there could be better adjectives to describe their differences in passband, stopband, and transition.
Can someone please help me compare these techniques into words? Thank you very much!
