2
$\begingroup$

New to signal processing, but making good progress, I think.

I have a series of (many) impulses I generated, which will be used as impulse responses to model our church's acoustics, in this time of covid-19.

A couple of questions, before the details:

  1. What is the best practice (and code solution) for detecting the onset of an impulse?

  2. When considering the spectrogram for an impulse, is it unusual for the spectrogram's data to occur earlier than the waveform, and before the waveform(db)?

Details:

Slap-boards were used to generate the impulses, which were recorded as 2 channel WAV files at 96000, 16bits, using my zoom H1n Handy Recorder. The impulses occur at quite regular times in the data, although not precisely regular, as the board slaps were done by hand, at the beat of my internal drummer, so to speak.

I have successfully used scipy.io.wavfile to split the data into two channels, and then used scipy.signal.find_peaks to get (very close to) the onset of each of the pulses by finding the peak of each impulse. However, I can see that the actual onset of each impulse is missed by this approach, and I would like to capture these individual onsets better using python.

I've been reading up, and am sure this is a deep and broad topic. However, perhaps some kind soul can assist me with the specifics of how to find the precise times of these onsets? I imagine this is a fairly typical type of problem in signal processing, and I realize it's (quite) a bit of an education that I'm requesting.

I'm really hoping for a code solution suggestion to find the onset of these kind of impulse data.

To be clear,

a) The maximum peak for each pulse is not at the onset, obviously, nor is it necessarily the first noticeable peak for each impulse, as I review the entire datastream. (I think when this delayed peak occurs, a reflected signal has a higher peak than the direct response at the recording device. I'm not certain of this though . . .)

b) The waveforms for these pulses do not necessarily go to zero between impulses, in fact, they rarely do. The signal goes close to zero, but not precisely. (I expect this has something to do with ambient noise around the signal, but am not certain . . .)

c) The waveform could go negative first, or positive (as is the case with the (initial) data from this sample impulse).

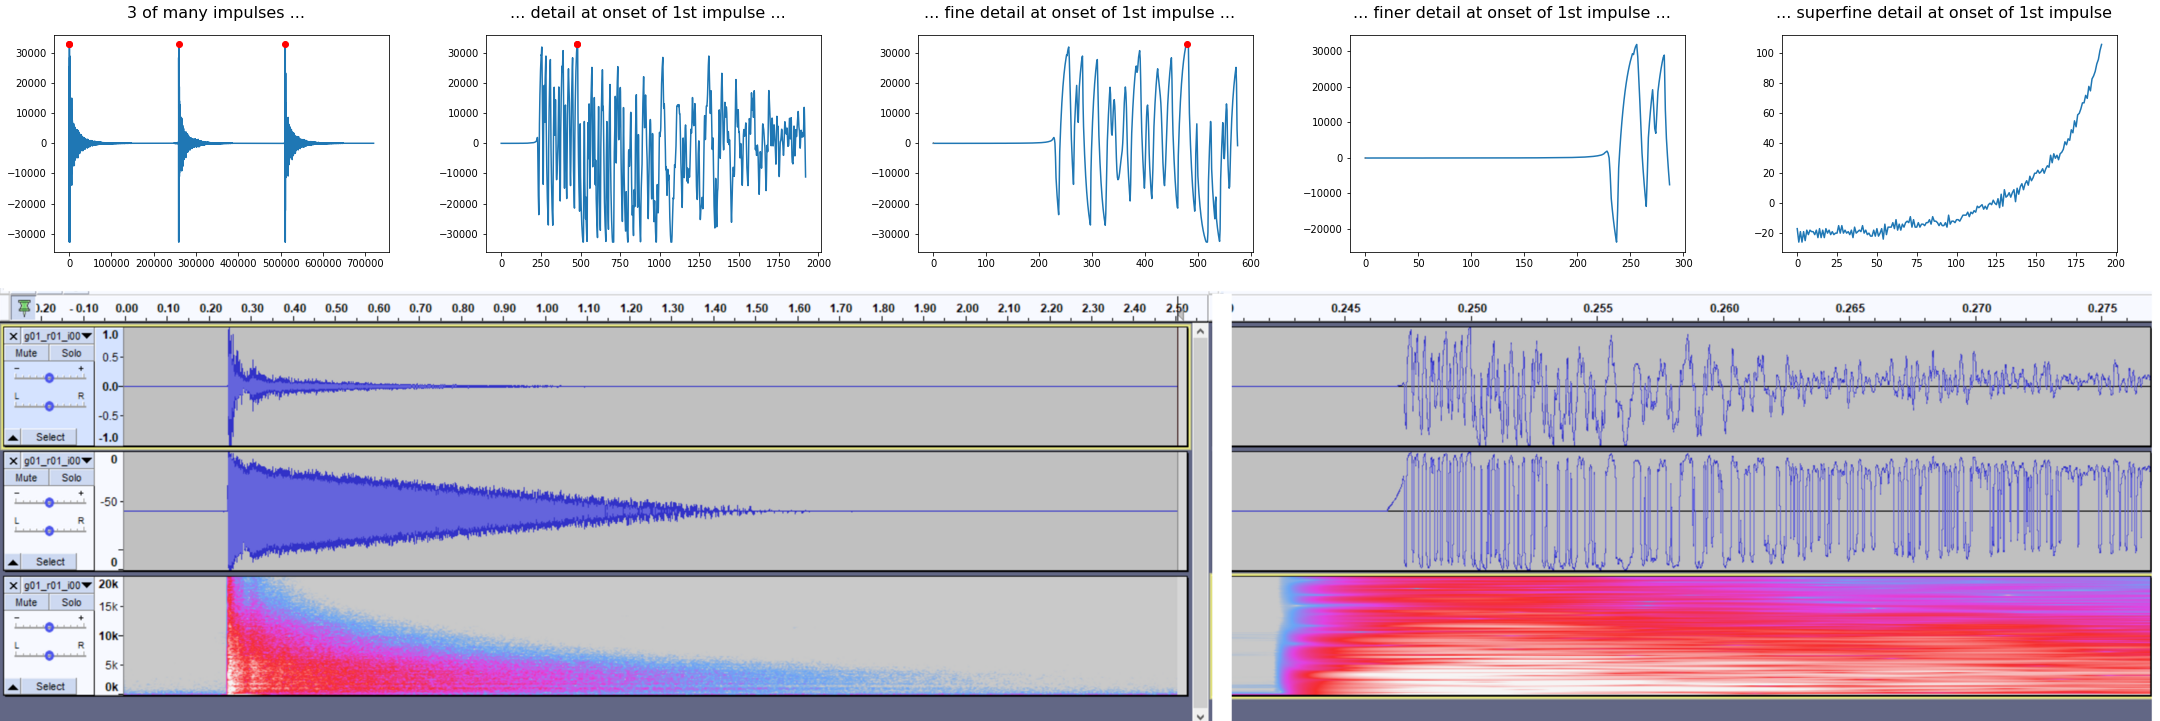
In the attached image, the top five graphs show a group of impulses (3 out of several hundred), followed by increasing resolutions zooming into the onset of the first impulse in this group.

The bottom two images are the left channel of the first impulse, taken as screenshots from Audacity. They show the waveform, the waveform(db), and the spectrogram for the first impulse -- on the left, the entire impulse, on the right, the onset of the impulse. (I am puzzled why the spectrogram appears to precede the waveform and waveform(db) by a measurable number of samples.)

Although I plotted the spectrograms in Audacity, I am not sure how to access spectral data in a WAV file, nor how to use it for detecting the onset of an impulse.

graphs of impulses for onset question

I'll try to attach the data leading up to the first impulse, and a little ways into this impulse, but these are quite large files. I don't the rules for sending large datasets.

Thanks for your help, kind ones.

I am not sure of what is going on in a WAV file, but here are 250 samples taken from the left channel, that I believe start from before the onset of the first impulse, and end somewhat into the impulse itself:

wav_left_subset = array([
          -23,    -16,    -20,    -19,    -18,    -19,    -15,    -20,
          -18,    -21,    -20,    -22,    -22,    -18,    -22,    -17,
          -22,    -20,    -17,    -24,    -14,    -21,    -16,    -16,
          -16,    -13,    -17,    -11,    -18,    -14,    -18,    -14,
          -16,    -13,    -12,    -13,     -9,    -16,    -11,    -16,
          -16,    -13,    -16,    -14,    -14,    -15,    -13,    -13,
          -11,    -14,     -9,    -12,    -12,    -13,    -15,    -13,
          -15,    -15,    -13,    -16,     -8,    -14,    -12,    -12,
          -13,    -11,    -11,    -12,    -10,     -8,     -8,     -8,
           -6,     -9,     -6,     -7,     -5,     -6,     -2,     -3,
           -2,     -1,     -4,     -2,     -4,     -1,      0,     -1,
            2,      0,     -1,      3,     -3,      6,     -2,      9,
            4,      5,      7,      4,      7,      9,      1,     10,
            6,     11,     13,      9,     13,     15,     12,     18,
           15,     17,     20,     20,     22,     20,     21,     23,
           20,     23,     25,     24,     32,     27,     33,     30,
           32,     29,     33,     34,     36,     41,     39,     43,
           42,     49,     47,     55,     51,     59,     60,     63,
           67,     67,     72,     70,     78,     75,     83,     85,
           88,     93,     96,    102,    106,    111,    115,    124,
          127,    135,    143,    146,    161,    163,    181,    185,
          197,    209,    222,    239,    249,    269,    281,    303,
          322,    344,    369,    399,    431,    466,    501,    544,
          588,    642,    701,    779,    858,   1003,   1152,   1466,
         1706,   1921,   1352,    -13,  -4626, -11419, -14567, -17320,
       -19721, -21829, -23673, -14863,  -2840,   2088,   6363,  10091,
        13343,  16173,  18656,  20820,  22727,  24392,  25864,  27162,
        28305,  29329,  29056,  30424,  31358,  31919,  28408,  22294,
        15638,   8584,   1428,  -3153,  -7130, -10605, -13629,  -4656,
         5684,   9787,  13358,  16474,  19186,  14213,   8269,   6929,
        12547,  18601,  21081,  23248,  25145,  26811,  28274,  28920,
        13555,   5571], dtype=int16)

$\endgroup$
6
  • $\begingroup$ Why do you want to detect the onset of pulses? You can process the impulse response as is if you want to equalise the church (for example). Can you share a bit more detail on the specific task at hand that you have? I think that would help a lot in receiving useful answers. $\endgroup$
    – A_A
    Commented Jun 26, 2020 at 10:07
  • $\begingroup$ Good questions -- three short answers, as to why. $\endgroup$ Commented Jun 26, 2020 at 18:48
  • $\begingroup$ (1) I have found that the impulse response, if it includes leading "dead" sound, results in a delay when convolved with music produced for the church. This delay should be minimized, but I don't want to lose any of the impulse response by cutting off the onset. (2) I have a spatial array of these impulse responses generated from around the church; I'm hoping to identify problem areas for listening, and for producing sound when we're back in the church. (3) I am new to this, and am eager to learn more about it. Number 1 is the most important now -- I want to fully utilize the entire response. $\endgroup$ Commented Jun 26, 2020 at 19:05
  • $\begingroup$ Can I please ask you to add these points to the question and somehow come up with a small number of "answerable" bullet points? I am going to do my best to address some of those but others are still in a "discussable" state, rather than having a definite answer. SE is less of a forum-type interaction, more of Q&A. For anything else there is a chat option too. $\endgroup$
    – A_A
    Commented Jun 27, 2020 at 11:04
  • $\begingroup$ Just a quick amendment to my earlier comment: You need to define what "problem areas for listening" means. Are you trying to control the reverberation of "the room" (where "the room" can be "an area")? Are you trying to boost / attenuate a specific frequency range within "the room"? $\endgroup$
    – A_A
    Commented Jun 27, 2020 at 12:03

1 Answer 1

2
$\begingroup$

What is the best practice (and code solution) for detecting the onset of an impulse?

...

The waveforms for these pulses do not necessarily go to zero between impulses, in fact, they rarely do. The signal goes close to zero, but not precisely. (I expect this has something to do with ambient noise around the signal, but am not certain . . .)

Both of these are expected when you are recording in an open field. For the impulse response data, you can measure the average strength of the background level and then consider the start of the impulse as the level that the waveform "breaks through" that noise level. Similarly for when the waveform comes back down to levels comparable to the background noise.

This is implemented in Audacity as the Noise Gate if you want to do a quick test.

The maximum peak for each pulse is not at the onset, obviously, nor is it necessarily the first noticeable peak for each impulse, as I review the entire datastream. (I think when this delayed peak occurs, a reflected signal has a higher peak than the direct response at the recording device. I'm not certain of this though . . .

If there is a direct line of sight between the source and the mic, then the first arrival is the direct one, purely judging by the distance the wave has to travel. Now, sound does not travel in straight lines. Sounds travels faster in higher density media (including air at different temperatures and pressures). But to start assessing how much these effects impact the room you are dealing with you would have to simulate sound propagation to figure out the reasons behind a specific recording.

(I am puzzled why the spectrogram appears to precede the waveform and waveform(db) by a measurable number of samples.)

The spectrogram view is interpolated between time instances Audacity runs the DFT on. You can find out more about it here.

From a theoretical point of view, an impulse is a sharp discontinuity in the time domain, which would result in a broad spectrum (more sinusoids required so that when they are summed, they can reproduce that discontinuity accurately).

So, a discontinuity shows up as a bright vertical bar in the spectrogram but because of the reasons explained here, there is no added benefit from the spectrogram in locating exactly where an impulse is supposed to start at.

... here are 250 samples taken from the left channel, that I believe start from before the onset of the first impulse, and end somewhat into the impulse itself:

You are recording at 96kHz. What you are looking at prior to the main impulse is the build up of the pressure wave front as it hits the microphone.

If there is a direct line of sight between the source and the microphone, you can take as $t=0$ the main impulse (the highest peak) and follow it up until it goes below the noise floor without losing any detail.

Hope this helps.

$\endgroup$

Your Answer

By clicking “Post Your Answer”, you agree to our terms of service and acknowledge you have read our privacy policy.

Not the answer you're looking for? Browse other questions tagged or ask your own question.