1
$\begingroup$

I know this is basic for signal processing, but, I am not sure what is wrong about my approach. I have a signal that behaves as damped sine signal with a sampling frequency of 5076Hz and 15,000 number of samples. I found from the following website how to convert a signal from a time domain to frequency domain and managed to get the FFT and frequency values. The code can be found below the link:

Machine Learning with Signal Processing Techniques

def get_fft_values(y_values, T_s, N, f_s):
    f_values = np.linspace(0.0, 1.0/(2.0*T), N//2)
    fft_values_ = np.fft.rfft(y_values)
    fft_values = 2.0/N * np.abs(fft_values_[0:N//2])
    return f_values, fft_values

I managed to get the frequency and FFT values. However, I need to implement filters to remove some noise from the signal, so, I created the following functions to implement the filter part:

def butter_bandpass(lowcut, highcut, fs, order):
    nyq = 0.5 * fs
    low = lowcut / nyq
    high = highcut / nyq
    b, a = butter(order, [low, high], btype='bandpass', output='ba')
    return b, a

def butter_bandpass_filter(data, lowcut, highcut, fs, order):
    b, a = butter_bandpass(lowcut, highcut, fs, order=order)
    y = filtfilt(b=b, a=a, x=data)
    # y = lfilter(b=b, a=a, x=data)
    return y

I know that I would need to implement the following steps:

  • Convert to the frequency domain
  • apply a bandpass filter to get rid of frequencies you don't care about
  • convert back to the time domain by inverse Fourier transform

So, I created the following inverse transform function, but, I can't get the filtered signal back and the amplitudes don't almost match the original signal. (For my case, I need to resample)

def get_ifft_values(fft_values, T, N, f_s):
    # Time axis:
    N = 9903
    S_T = 1 / S_F
    t_n = S_T * N  # seconds of sampling
    # Obtaining data in order to plot the graph:
    x_time = np.linspace(0, t_n, N)
    ifft_val = np.fft.irfft(fft_values, n=N)
    y_s, x_time = scipy.signal.resample(x=ifft_val, num=N, t=x_time)
    return x_time, y_s

My Approach and here are the results from the signal:

##### Converting the signal into fft:
f_val, fft_val = get_fft_values(y_values=y, T=S_T, N=N, f_s=S_F)
# Applying bandpass filter:
fft_filt_val = butter_bandpass_filter(data=fft_val, lowcut=50, highcut=600, fs=S_F, order=2)
# Applying the inverse transform of the frequency domain:
x_time, y = get_ifft_values(fft_values=fft_filt_val, T=S_T, N=N, f_s=S_F)
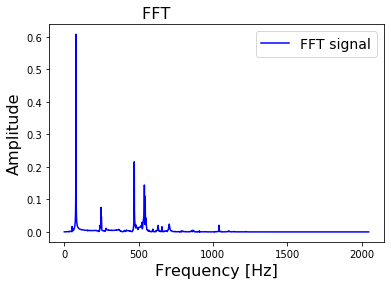
  • FFT of the original signal:

FFT of the original signal

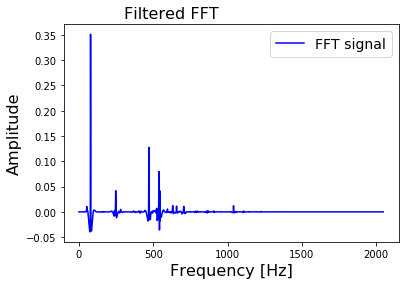
  • Filtered FFT of the original signal:

Filtered FFT from FFT values

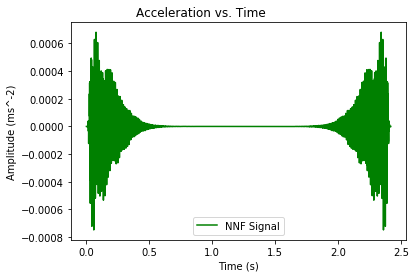
  • Converted Signal from Filtered FFT:

Converted Signal from Filtered FFT

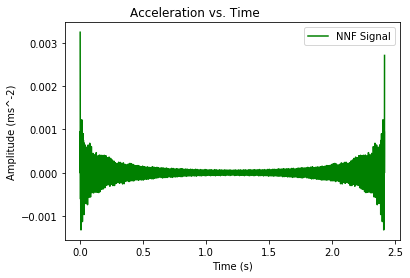
  • Without Applying the bandpass filter:

Without Applying the bandpass filter

What am I doing wrong here?

$\endgroup$
3
  • $\begingroup$ What are you trying to do? Those waveforms are consistent with the process you described. $\endgroup$
    – Dan Szabo
    Commented Jun 22, 2020 at 14:20
  • $\begingroup$ @DanSzabo Well, the amplitudes do not look the same as the original signal my signal is an exponential decay with the sampling frequency and number of samples (which can be found in the question) $\endgroup$
    – WDpad159
    Commented Jun 22, 2020 at 14:44
  • $\begingroup$ You’re explicitly modifying the amplitudes by filtering. Why wouldn’t you expect them to change? Also, you throw away the phase data after calculating the FFT. Was that intentional? Also, I’d recommend using circular convolution for the filtering. I don’t know that filter implementation well enough to say it’s not, but if it isn’t you’ll probably get some odd stuff. $\endgroup$
    – Dan Szabo
    Commented Jun 22, 2020 at 15:25

1 Answer 1

2
$\begingroup$

You shouldn't perform the filtering operation on the FFT data, but on the original time domain data. The functions filtfilt and lfilter both take time domain data as their inputs, not frequency domain data. Filtering can also be implemented in the frequency domain (by multiplication), but the functions you're using don't do that.

$\endgroup$
7
  • $\begingroup$ Thank you Matt for the answer and clarification. Can you explain more about the multiplication with regards to the frequency domain and is there an example (blog/tutorial) that I can see into its theory and its implementation in python? $\endgroup$
    – WDpad159
    Commented Jun 23, 2020 at 14:34
  • $\begingroup$ @WDpad159: Frequency domain methods are mainly used for the implementation of FIR filters. Just search for 'overlap-save' and 'overlap-add' methods. The filter you designed is an IIR filter, and they are usually implemented directly in the time domain. So I would recommend you just use filtfilt or lfilter on your time domain data. $\endgroup$
    – Matt L.
    Commented Jun 23, 2020 at 15:07
  • $\begingroup$ Well, I would like to remove some noise in my signal in order to implement a peak detection system. I will have a look into FIR filters in python and I will come back if I have any questions. Thank you. $\endgroup$
    – WDpad159
    Commented Jun 23, 2020 at 15:15
  • $\begingroup$ @WDpad159: OK, just to make sure I was clear: you can remove noise by filtering in the time domain, so you don't necessarily need to use an FIR filter. $\endgroup$
    – Matt L.
    Commented Jun 23, 2020 at 16:06
  • $\begingroup$ Quick question, I managed to look into my signal and apply the bandpass filter on my time-domain signal and managed to get it to work. I just would like to know as I am using Butterworth bandpass filter, how can I know the optimum order number to use for the filter? $\endgroup$
    – WDpad159
    Commented Jun 23, 2020 at 16:21

Your Answer

By clicking “Post Your Answer”, you agree to our terms of service and acknowledge you have read our privacy policy.

Not the answer you're looking for? Browse other questions tagged or ask your own question.