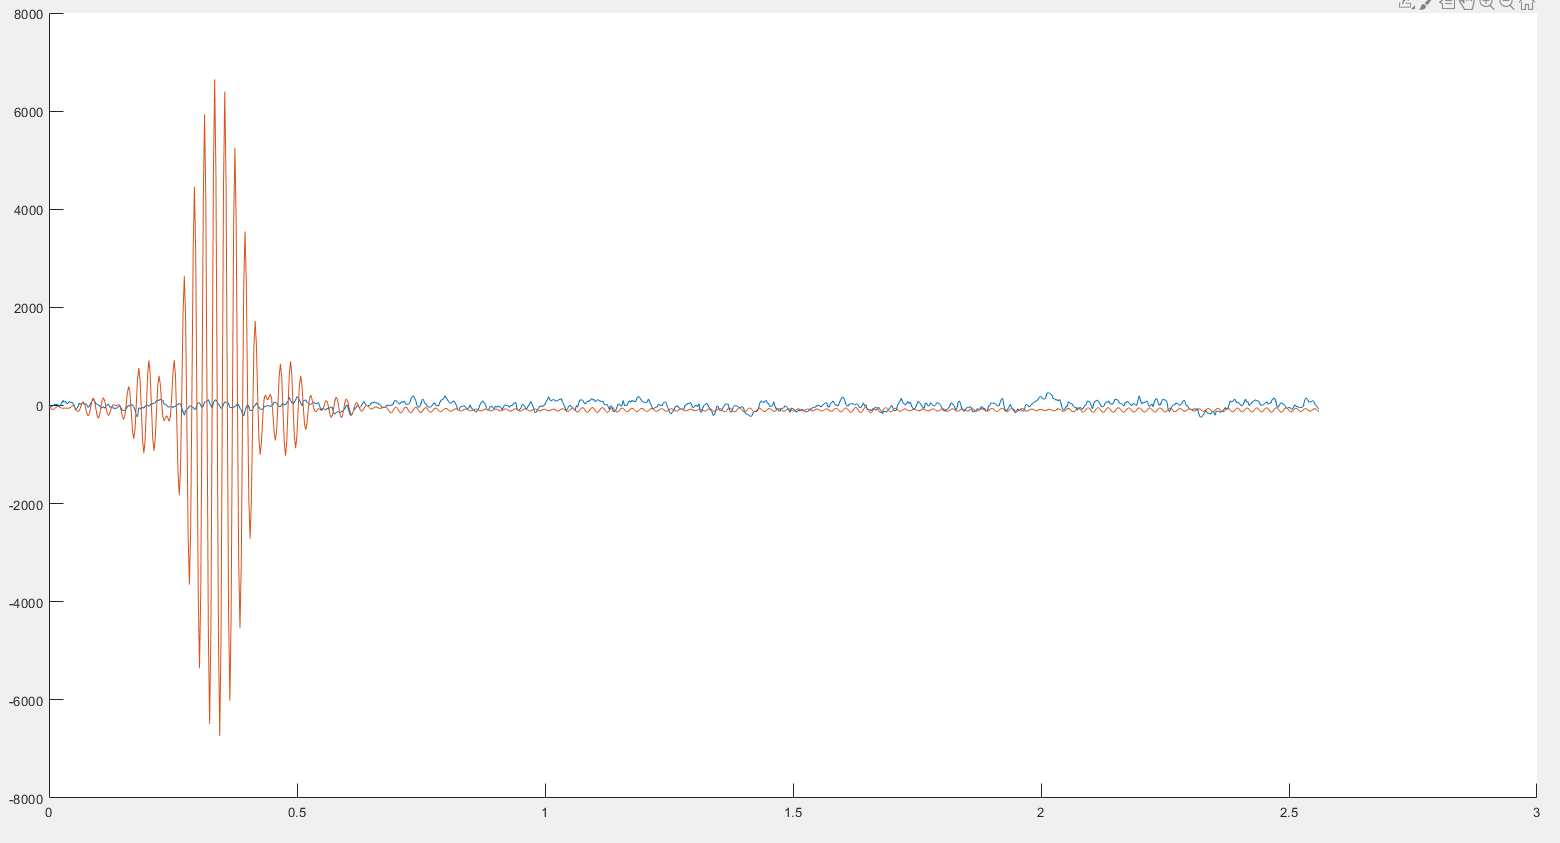
i have been tinkering with some fir filters to bandpass-filter a signal. Even though the filter looks pretty descent in frequency domain, i receive a quite strange "filtered" signal in time-domain. I think, i'm oversseing something simple... Maybe one of you knows what i am doing wrong.
First of all, here's the code:
Fs          = 200; % hz
nyquistFreq = Fs/2;
frange      = [45 55];
order       = round( 30*Fs/frange(1) );
filtKern    = fir1(order,frange/nyquistFreq);
filtSignal  = filter(filtKern,1,signal);
I plotted the data stored in signal and filtSignal into one plot and the filter-shape is received at the beginning of the filtered signal:
Here's a picture of the filter in time-domain, in frequency-domain and in frequncy-domain with logarithmic scale. According to the plot in frequency domain, the cut-off frequencies fit pretty much what i requested...
Thank you so much, i appreciate every input!


filtSignalgains so much energy. It also will help if you can describe your signal and what you expect as an output $\endgroup$