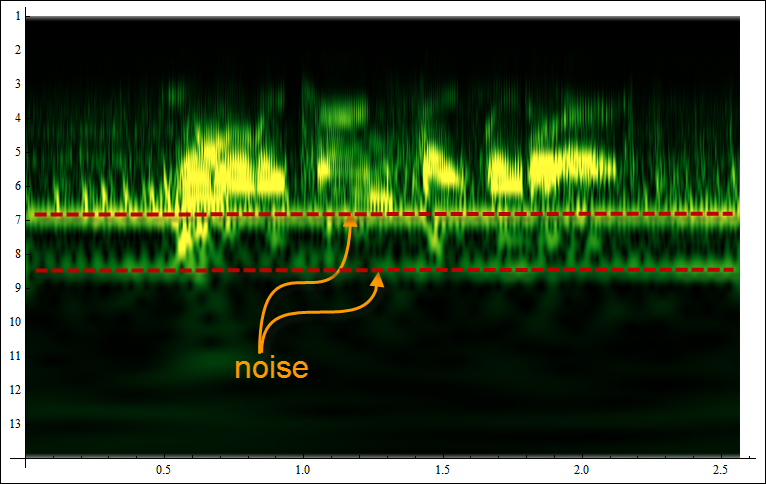
Generally below intensity of the color will tell you about importance of a frequency. Some programming languages have this functionality built in. Let's take for example Mathematica (has free trial). Let's import some sample recording:
voice = ExampleData[{"Sound", "Apollo11ReturnSafely"}]

Here is built in Spectrogram function:
s = voice[[1, 1, 1]]; r = voice[[1, 2]];
Spectrogram[s, SampleRate -> r]

with time on horizontal and frequencies on vertical axes. For wavelets though it is more natural to use Scalogram. Here is built-in function WaveletScalogram:
cwt = ContinuousWaveletTransform[voice, GaborWavelet[6]];
WaveletScalogram[cwt, ColorFunction -> "AvocadoColors", ColorFunctionScaling -> False]

Scalogram can provide useful info. For example it is great for visualizing voice versus noise feature. Voice is more rich and irregular in structure, noise is more monotonic and repetitive. Horizontal axis is time. Vertical axis is octaves. Higher frequencies are resolved at lower octaves and lower frequencies at higher octaves.
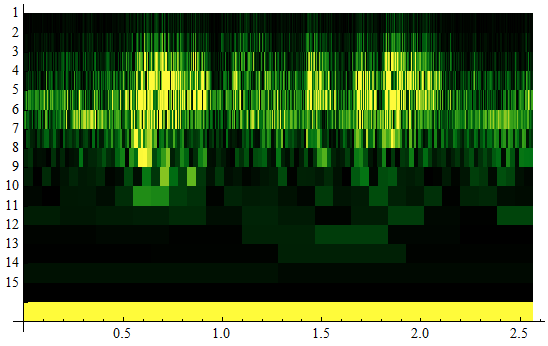
For DWT you will have a similar plot:
cwt = DiscreteWaveletTransform[voice];
WaveletScalogram[cwt, ColorFunction -> "AvocadoColors", ColorFunctionScaling -> False]


