1
$\begingroup$

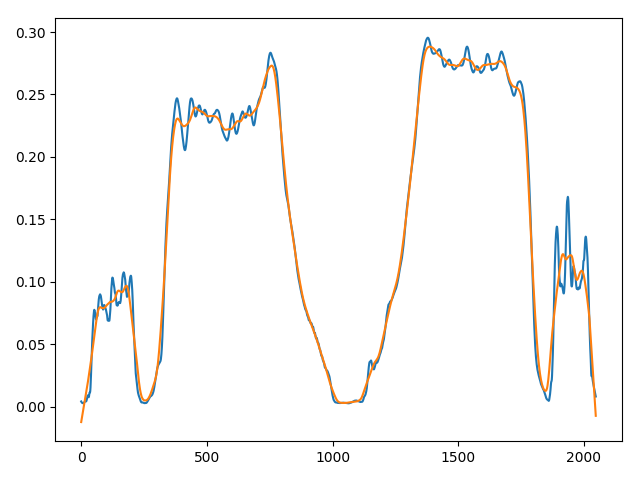
I want to segment the following signal (units are x: [px], y: [a.u.]) and need a good way to do so. I want to achieve the following:

  1. I am only interested in the two wide "plateaus" with maximum value (e.g. (1) from ~400px to ~800px and (2) from ~1300px to ~1800px).
  2. Ideally would like the solution to be parameterless.

In the figure the blue line is the original signal and the orange line is the signal filtered by savgol_filter(signal, 51, 1).

I have tried Otsu's method, but it is not optimal, because it is intended for separating a foreground from the background. This is not the case here, which is why I had to do the smoothing (which introduces a parameter(!)) to reduce the noise in the side-peaks, so that they do not "leak" into the foreground, when using Otsu.

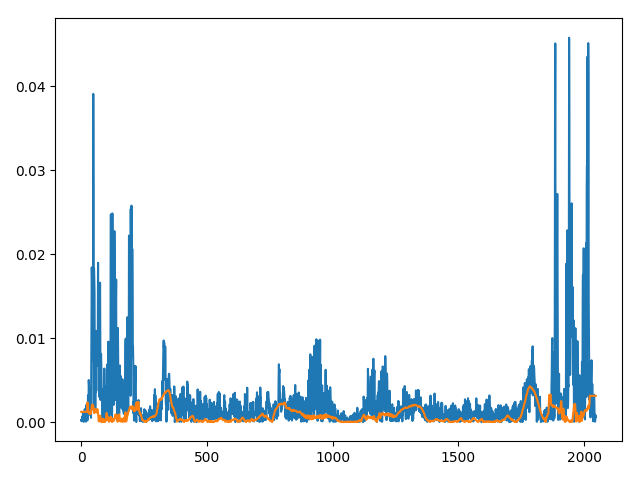
I have considered using the derivative of the signal, which should be very strong the flanks of the plateaus (see second figure), but here again the noise in the side-plateaus is causing an issue.

So what would be a good way to segment this signal?

Signal to segment:

signal_filtered = savgol_filter(signal, 51, 1)
plt.plot(signal)
plt.plot(signal_filtered)
plt.show()

Signal and smoothed signal

Differential of signal and smoothed signal:

plt.plot(np.abs(np.diff(signal))), plt.plot(np.abs(np.diff(savgol_filter(signal, 51, 1)))), plt.show()

Differential of signal and smoothed signal

EDIT:

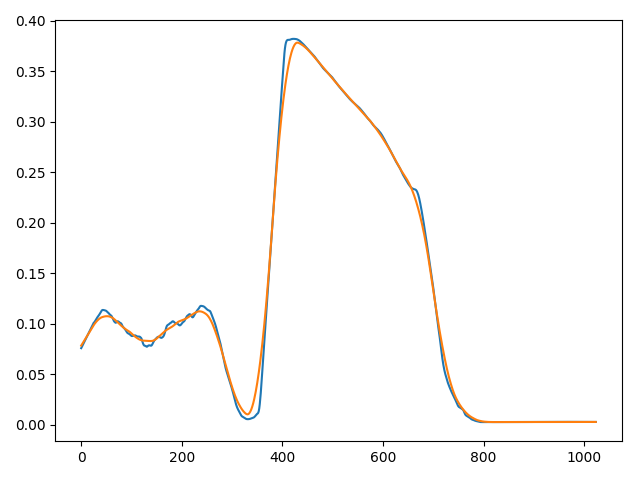
Signal with single, non-flat plateau:

Signal with single, non-flat plateau

$\endgroup$
5
  • $\begingroup$ Would you say that this is a representative item from your dataset or is it possible to have other variations (?) $\endgroup$
    – A_A
    Commented Apr 30, 2019 at 14:51
  • $\begingroup$ "I am only interested in the two wide "plateaus" with maximum value" - this requirement has to be quantified, your algorithm needs to know why you're interested in these. Because of the fact that they are wide? Then a minimum width of "interesting" plateaus is something you need to quantify. Or because of their high amplitude? Then the minimum height of an interesting amplitude is something you need to specify. Unless you do, it's hard to suggest something specific. It looks like hysteresis-based thresholding might help (it's good against noise). $\endgroup$
    – Florian
    Commented Apr 30, 2019 at 15:16
  • $\begingroup$ Thanks for your questions, so: 1. I cannot be 100% sure about the height of the plateaus, which is why I cannot set a fixed threshold value. 2. Width of the plateau is known, because this signal is derived from a periodic structure in an image an I can require the user to specify the width of this structure. 3. Finally, the number of plateaus can vary. At the moment it will be either one or two (should have noted this, sorry) Note that the plateaus do not need to be completely flat (apart from the noise). I have one dataset that "tapers" tail of to one side. I will include it in a sec. $\endgroup$
    – packoman
    Commented Apr 30, 2019 at 15:23
  • 1
    $\begingroup$ @A_A please see my new other comment and my updated question (sorry for spamming). $\endgroup$
    – packoman
    Commented Apr 30, 2019 at 15:32
  • $\begingroup$ @Florian please see my new other comment and my updated question (sorry for spamming). $\endgroup$
    – packoman
    Commented Apr 30, 2019 at 15:32

1 Answer 1

2
$\begingroup$

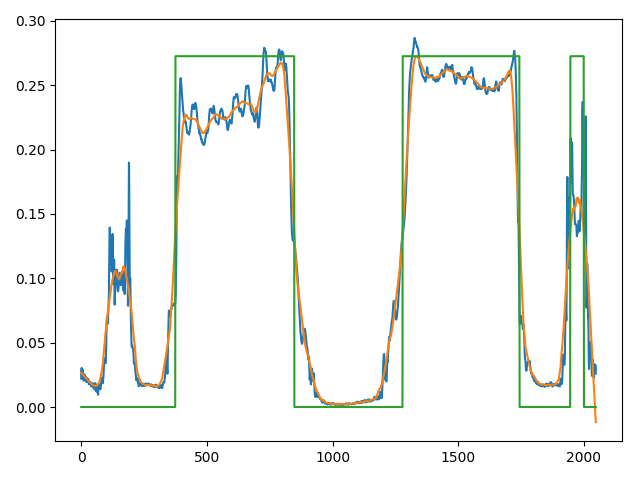
I solved this by still using Otsu to find the threshold value. I then just filter the the regions with value == 1 in the thresholded signal (i.e. the region_mask; green line in plot below) by their width. This is the result, where the rectangular peak on the right will be filtered (see below for the code):

plt.plot(signal_orig)
plt.plot(signal)
plt.plot(region_mask * np.max(signal))
plt.show()

enter image description here Code:

signal = savgol_filter(signal_orig, 51, 1)  # window size 51, polynomial order 1
threshold = threshold_otsu(signal)

region_mask = signal > threshold
region_list = get_regions_from_mask(region_mask)
region_list = filter_date_regions_by_width(region_list, minimum_region_width=200)


def filter_date_regions_by_width(region_list, minimum_region_width):
    """
    Filters removes data regions from region_list with width < minimum_region_width.

    :param region_list: list of DataRegion objects, that we want to filter.
    :param minimum_region_width: minimum width of a region, so that it is not filtered out.
    :return:
    """
    filtered_list = []
    for region in region_list:
    if region.width >= minimum_region_width:
        filtered_list.append(region)
    return filtered_list


def get_regions_from_mask(region_mask):
    """
    Get list of the DataRegion objects that were found inside region_mask.

    :param region_mask: the np.array of 0 and 1 in which we want find regions of value == 1.
    :return: region_list: a list of DataRegion objects.
    """
    region_list = []  # list that will hold all regions that were found
    region = DataRegion()  # object to hold the start and end values of the region
    inside_region = False  # indicates, if we are currently inside a mask_region with value=1
    for index, value in enumerate(region_mask):
    if value == 1 and not inside_region:
        # entered a region
        inside_region = True
        region.start = index
    if value == 0 and inside_region:
        # left a region
        inside_region = False
        region.end = index
        region.width = region.end - region.start
        region_list.append(region)
        region = DataRegion()
    return region_list

Definition of the DataRegion class:

from dataclasses import dataclass


@dataclass
class DataRegion:
    start: int = None
    end: int = None
    width: int = None
$\endgroup$

Your Answer

By clicking “Post Your Answer”, you agree to our terms of service and acknowledge you have read our privacy policy.

Not the answer you're looking for? Browse other questions tagged or ask your own question.