I've attempt to implement the algorithm from the paper "Burst Deblurring: Removing Camera Shake Through Fourier Burst Accumulation".
The main idea is to take several frames of the same scene, each blurred due to camera shake originated from hand tremor vibrations (which are random in nature). Since the camera trajectories of each frame are different, the blur kernels are also different. Thus, each Fourier frequency of the original scene will be differently affected on each frame of the burst.
Now we can reconstruct an image whose Fourier spectrum takes for each frequency the value having the largest Fourier magnitude in the burst. Since a blurring kernel does not amplify the Fourier spectrum, the reconstructed image picks what is less affected from each image of the burst.
Obviously in a real scenario there are additional variables affecting the reconstruction (scene/lighting changes during burst, frames misalignment, noise, etc.), but I'm am dealing with a simple toy-case where I took a sharp image and blurred it with 100 different normalized and centered blur kernels (the blur kernels centers of gravity were centered up to sub-pixel values, so not [0,0], but [0.2,-0.3] for example).
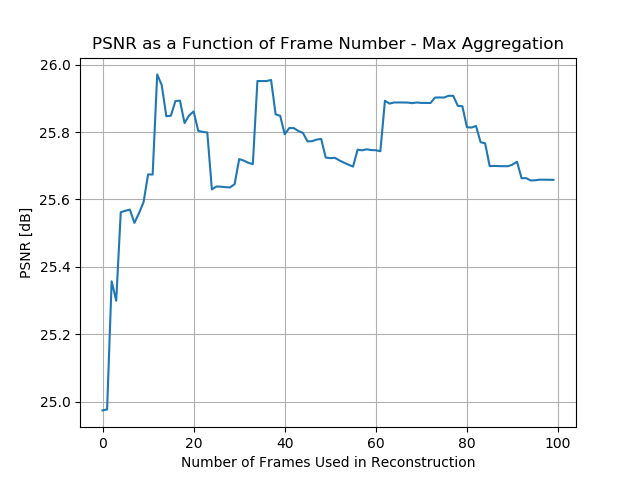
The results are 100 blurred images which should be aligned and noise free.I than used them to reconstruct the original image and I examined the PSNR compared to the original image based on the number of frames used:

What I don't understand is what is the source for the drops in PSNR values when taking more frames (like 25 frames compared to 15)? For my toy-case, shouldn't the plot be monotonically increasing?
The code for the algorithm:
    if max:
        image = np.zeros(shape=(fft_shape[0], fft_shape[1]), dtype=np.complex128)

        # Get the point-wise Fourier magnitude for each frame:
        fft_abs = np.abs(blur_ffts)

        # The best frame per Fourier-pixel:
        best_frame = np.argmax(fft_abs, axis=0)

        # Reconstructing the Fourier transform of the image:
        for i in range(fft_shape[0]):
            for j in range(fft_shape[1]):
                image[i, j] = blur_ffts[best_frame[i][j]][i][j]
