7
$\begingroup$

I'm trying to detect when a signal is "on" from samples I have. Those samples come from a software defined radio, if that matters, and the signal i'm trying to detect is a WiFi signal.

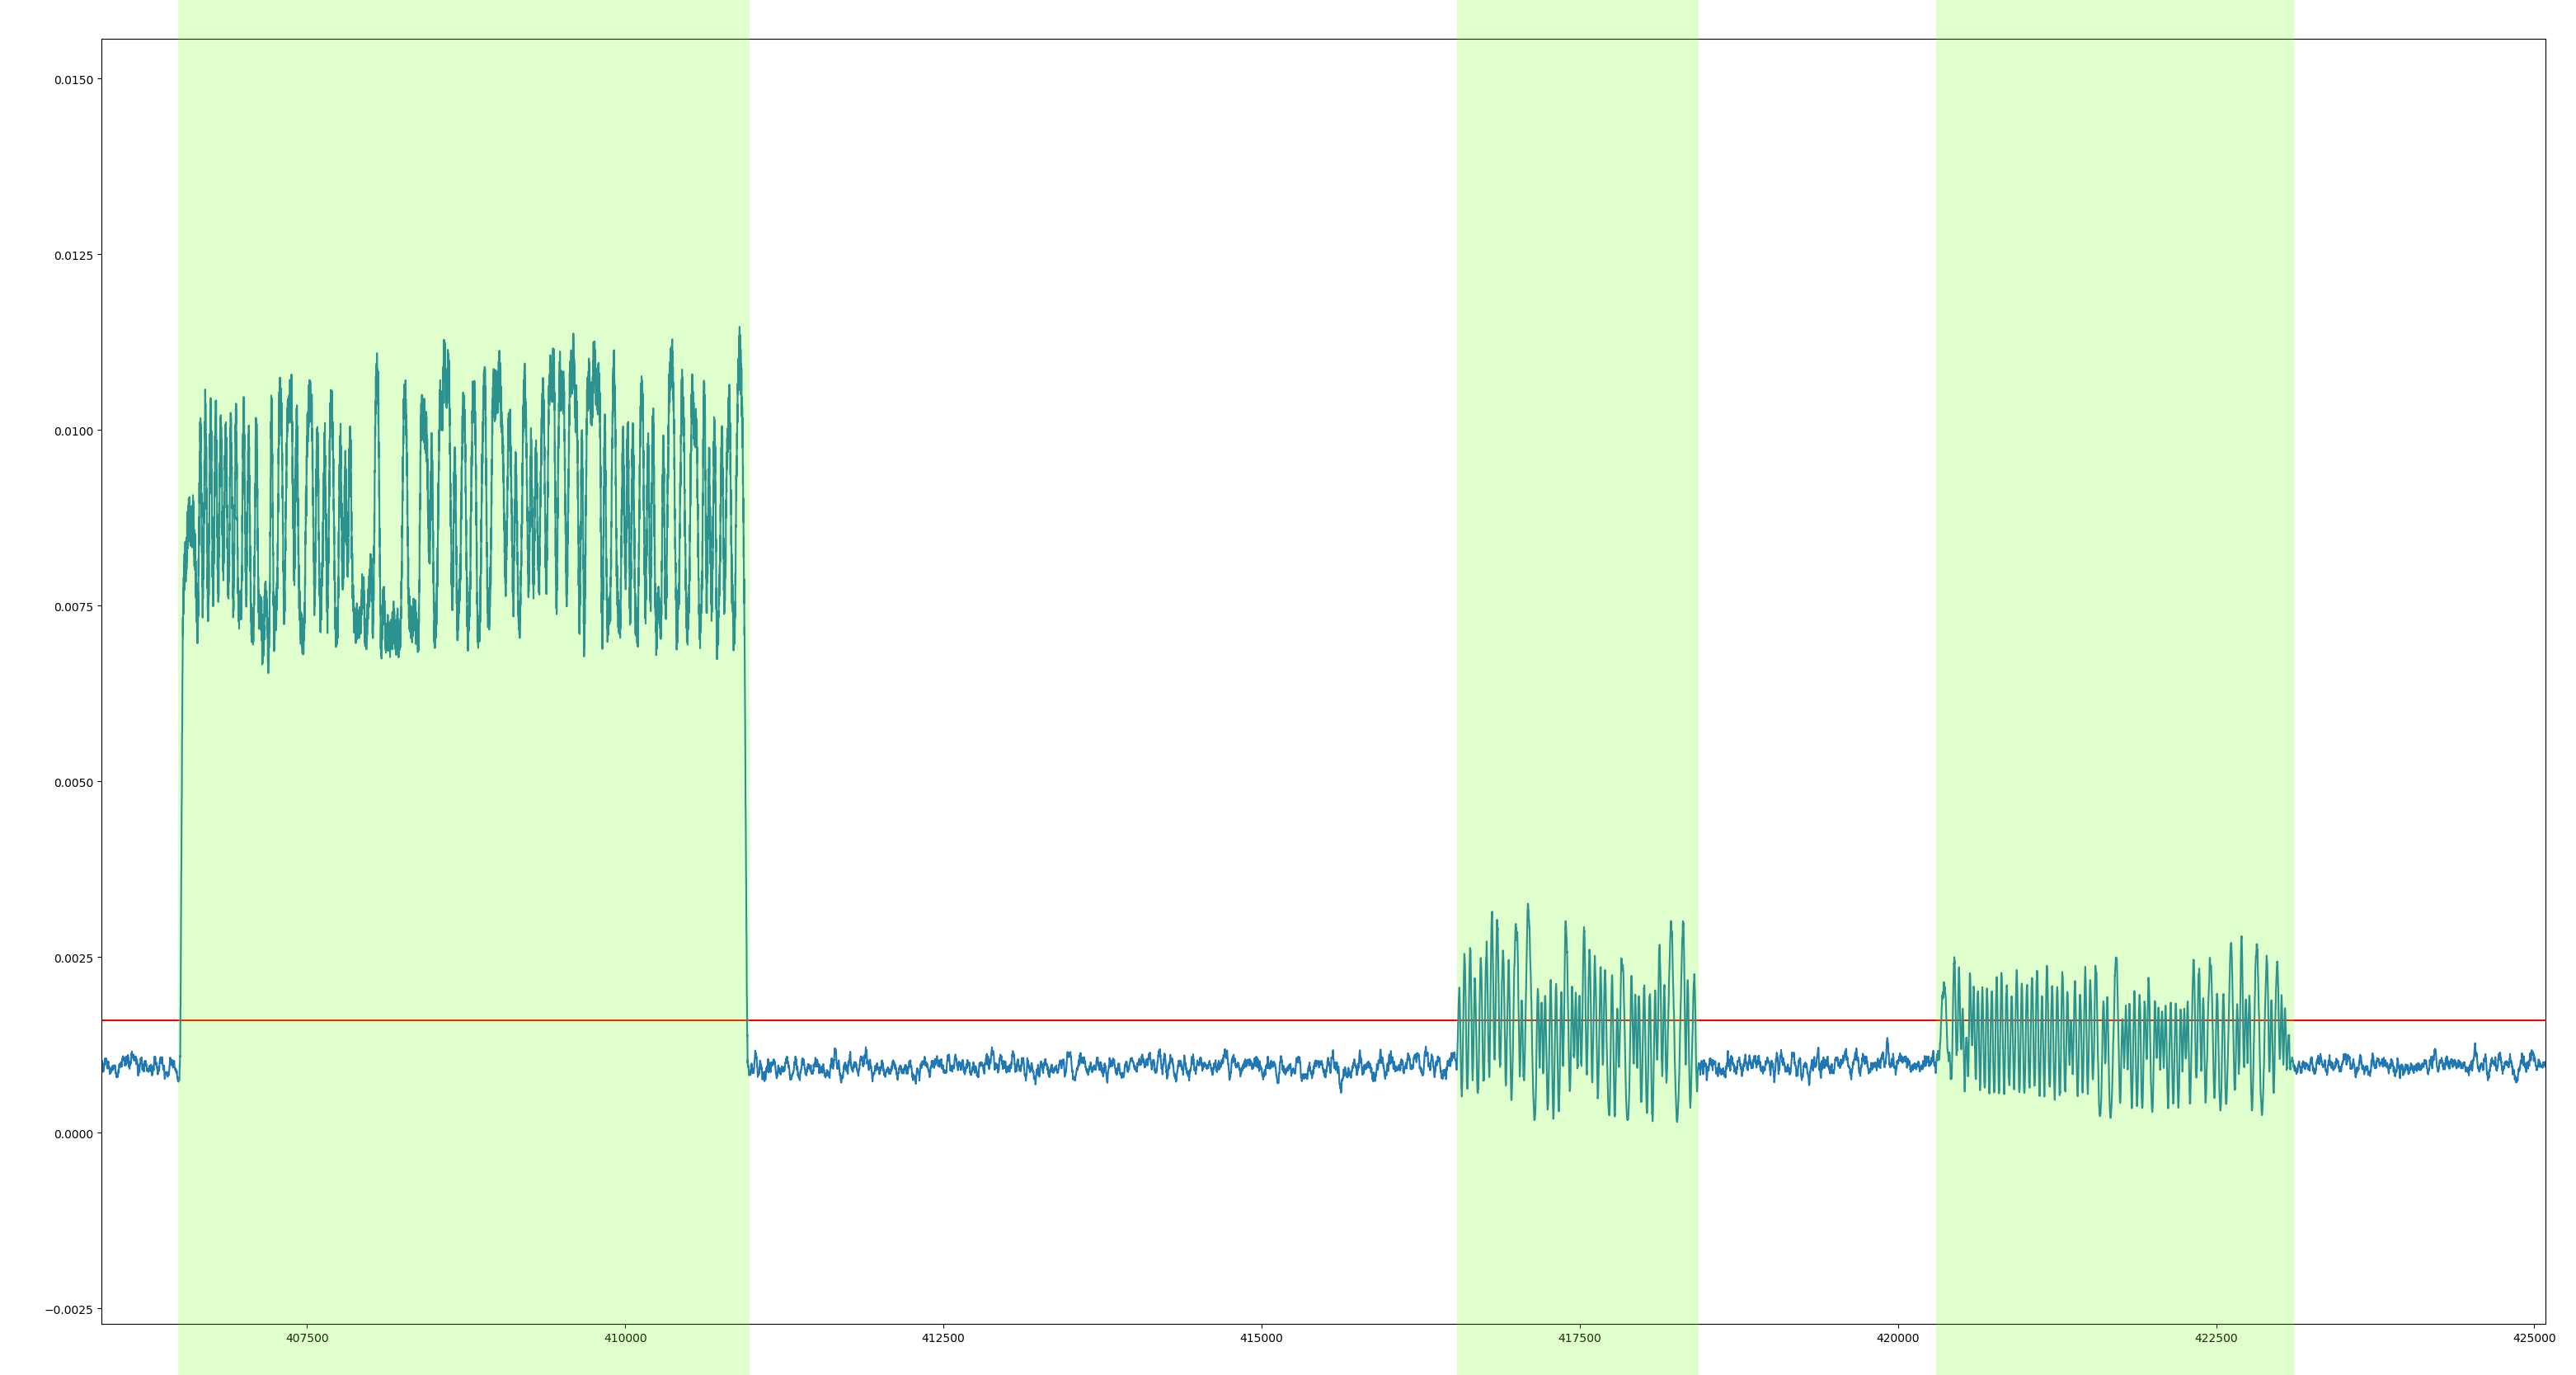
The problem is separating "noise" from "signal", as I did by hand on the following image; green parts are when the signal is on, and non colored ones are when there is no signal (x axis: samples, y axis: energy level).

Example of output i'd like

The main problem I have is that I do not now how to detect such signals, automatically. I tried by using threshold, but the noise level is subject to change. I can always determine when a signal is emitted « graphically », but i'd like to do this automatically.

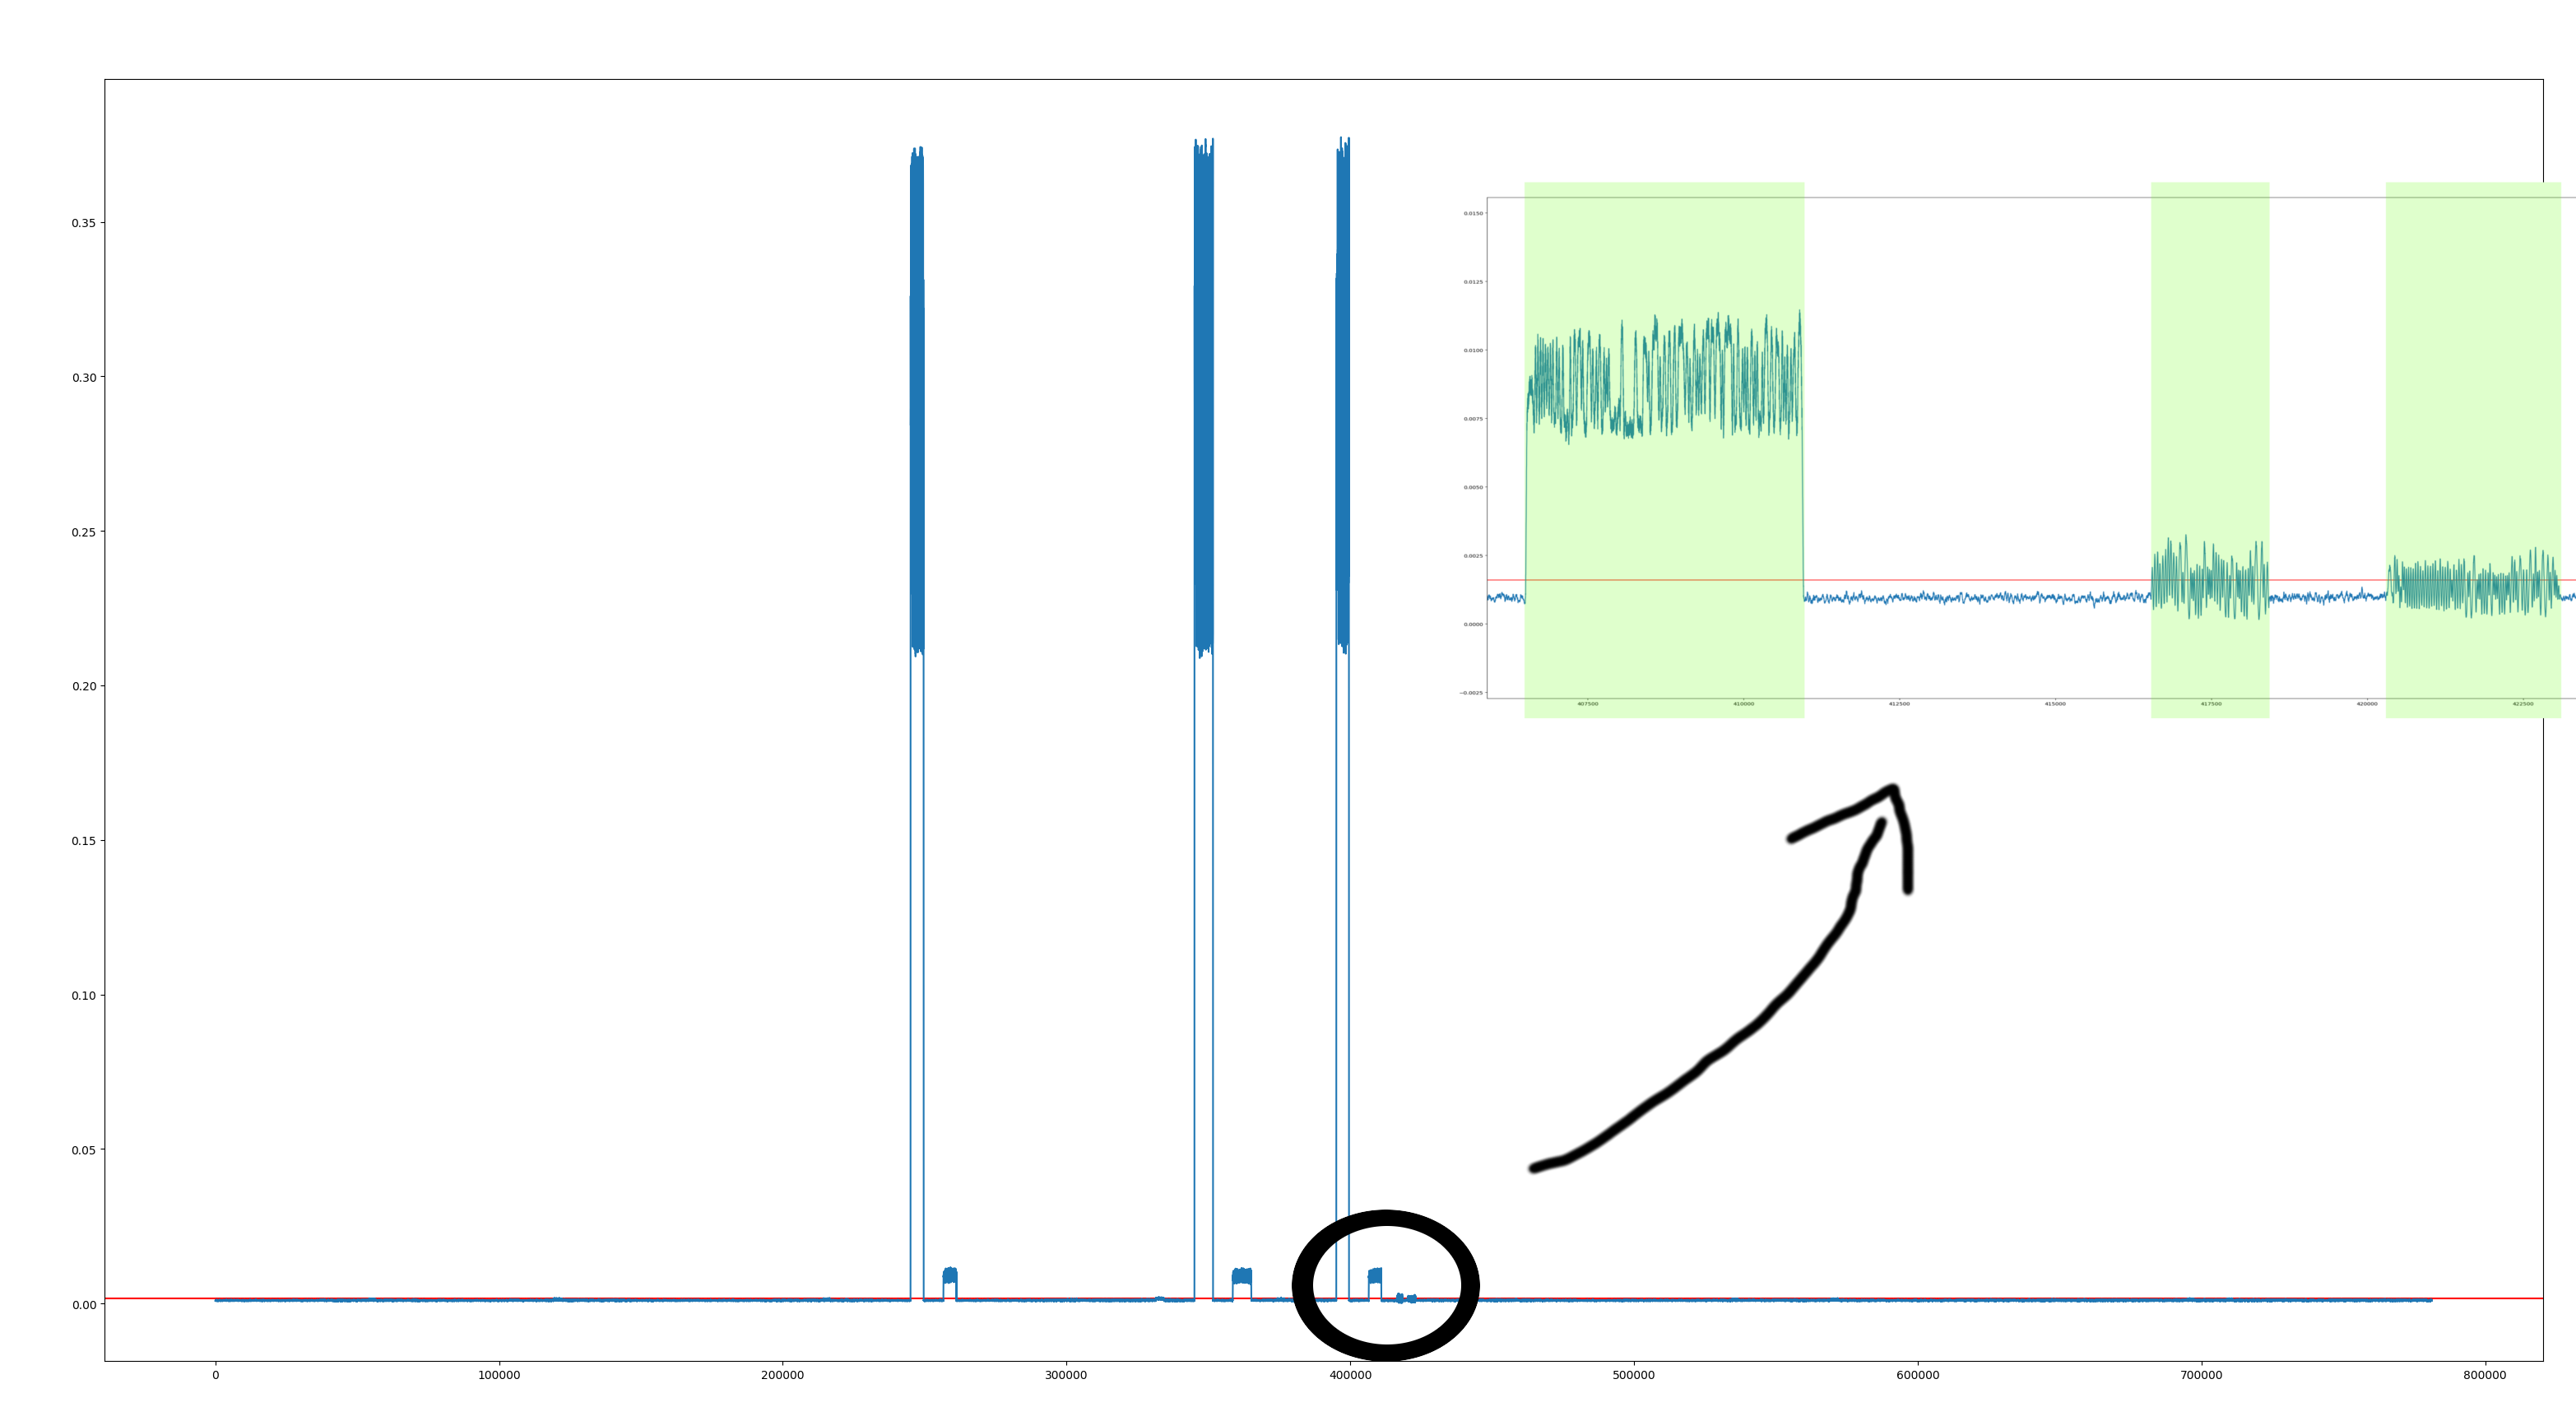
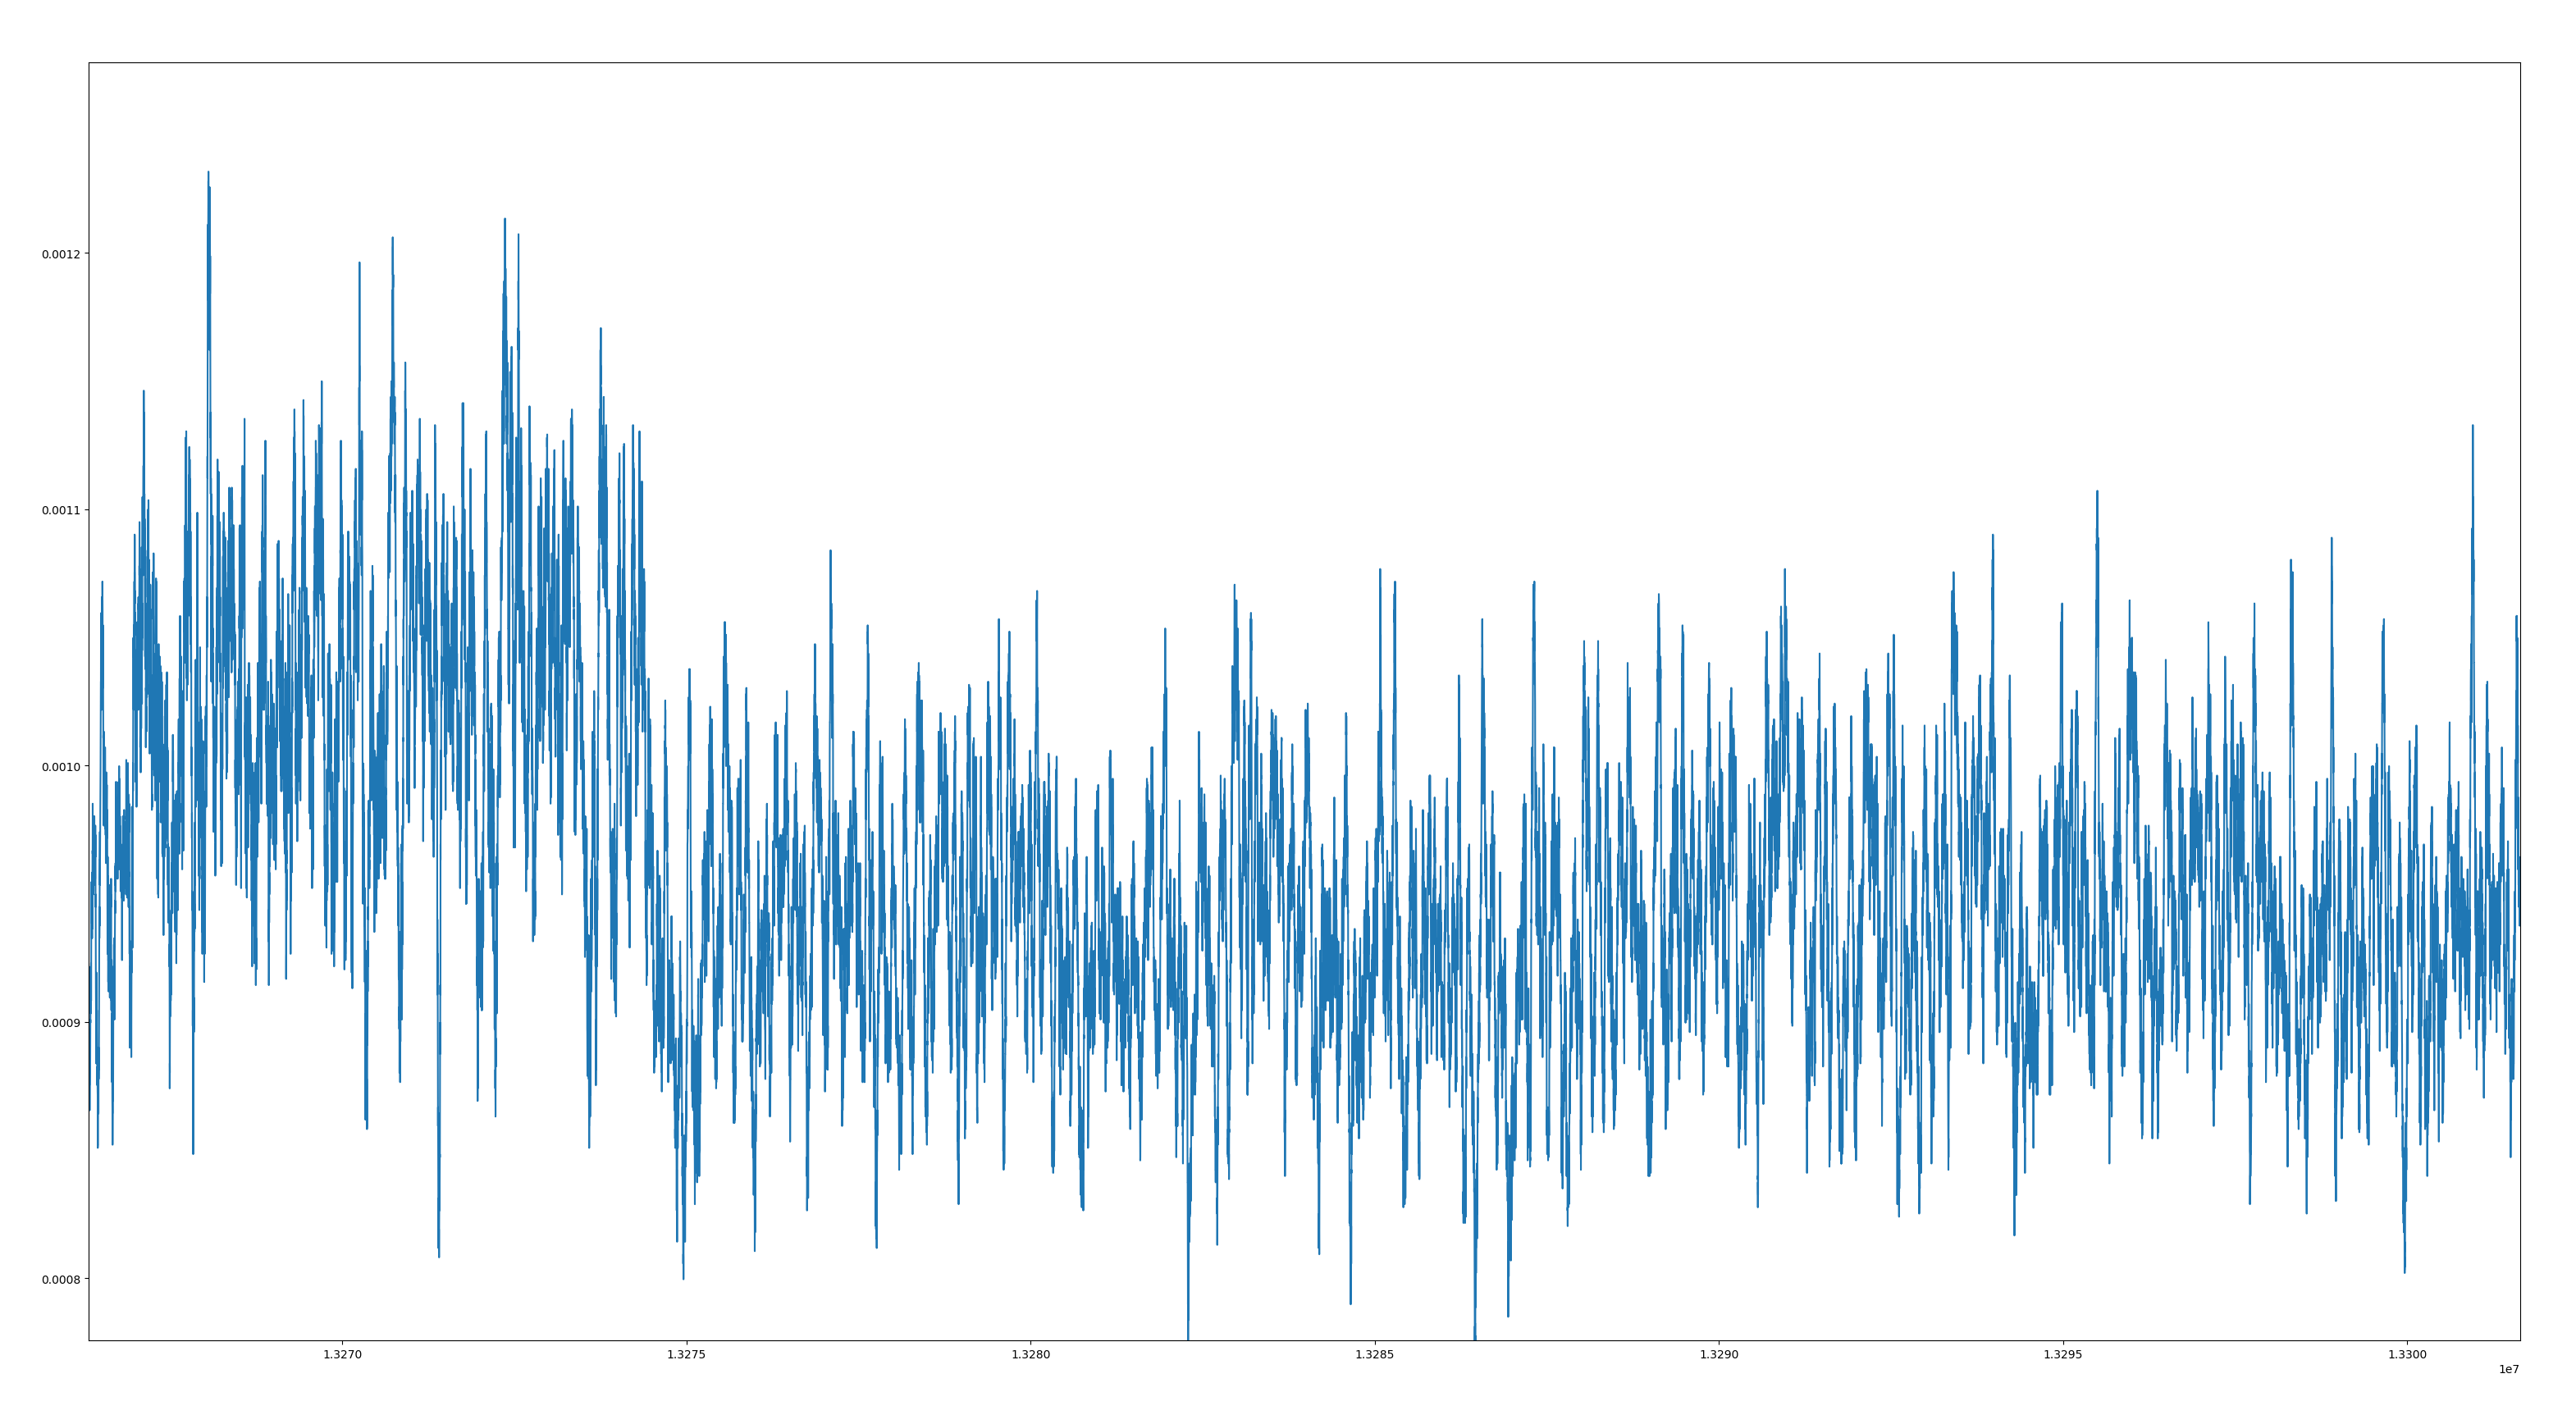
Below is an exemple of "tricky" situation (signal is on on the left of the image):

There is a wide range of "magnitude" in the signals

What method could I use? I'm searching, specifically, to approach the one in use in Wifi card, to sense signal and avoid interferences.

$\endgroup$
2

3 Answers 3

3
$\begingroup$

I have dealt with similar problems before. Probably the first you need to know is how does the noise spectrum look like.

First approach (mostly empirical): I see your signal of interest (SoI) is a train of rectangular pulses, thus the main frequency components are around DC. You can low-pass filter it to remove the main noise components (probably a moving-average filter will do). Then set a detection threshold (empirically), to a value that will be always surpassed by the filtered SoI, and rarely or never by the filtered noise.

Second approach (mostly theoretical): Check the noise components in the frequency domain (apply FFT). If the noise is nearly flat from DC to $f_s/2$, you can apply the optimal solution to this detection problem, which is implementing an energy detector, as follows:

  1. Assuming we're in presence of (zero mean) Gaussian noise, estimate its statistics (noise variance will do).

    How to do it? Since your SoI is a train of rectangular pulses, its main frequency components are around DC. You can high-pass filter it to remove the SoI. If the filter's cut-off frequency is low enough, the filtered noise will keep a similar noise variance after filtering. Otherwise, multiply the after-filter variance by $(f_s/2)/(f_s/2 - W)$, where $W$ is the filter's bandwidth, and $f_s$ is the sampling rate.

  2. Apply the optimal threshold for detecting a signal in AWGN: $$ \lambda = 2~\sigma^2_\omega ~ \sqrt{N}~ \left(Q^{-1}(P_{fa}) + \sqrt{N}\right)~~~~[1] $$

    $\sigma^2_\omega$ is the noise variance, $N$ is the signal length (number of samples of the sliding buffer, see step 3), $P_{fa}$ is the design false-alarm probability (i.e., how likely you would admit a false alarm to be triggered).

  3. Use a sliding buffer to analyze the whole signal by pieces, and what you need to compare to $\lambda$ is the energy contained in such a buffer: $$E = \sum^{N-1}_{n = 0} |x[n]|^2$$

More details on the second approach can be found, for example, here:

[1] S. Atapattu, C. Tellambura, and H. Jiang, Energy Detection for Spectrum Sensing in Cognitive Radio, Springer 2014. Chapter 2: Conventional Energy Detector.

$\endgroup$
2
  • $\begingroup$ Re: first approach: the power is rectangular bursts. The signal itself is usually zero-DC. $\endgroup$ Commented Apr 14, 2018 at 3:35
  • $\begingroup$ Second approach: no! OFDM, within its bandwidth looks white (aside from the suppressed DC carriers and guard carriers), and determining the the spectral "unevenness" will be a very fragile thing to do, because if there's signal, the unevenness is limited to these unused carriers, which still contain significant sidelobe power (unless you're already synchronized to the signal, but then you'd not worry about detection)! So, I'd really advise against going the routes you're proposing in this specific case. $\endgroup$ Commented Apr 14, 2018 at 3:39
1
$\begingroup$

I'm literally sitting on a tropical island, phone in one hand, do please excuse my brevity:

Yes, as usual, the type of signal of interest is very important!

Detecting OFDM is a bit of a hard task, as OFDM signals are practically sharply bandlimited white noise to the (unsynchronized) observer.

Hence, many methods that are based on spectral properties of SoI being different than those of background noise will simply fall flat, lest you have a lot of extraneous bandwidth to work with (which, with WiFi bandwidths of 20 or 40 MHz would be computationally pretty expensive just to do boring detection). Especially the conventional detector outlined in the other answer will work badly in less-than-stellar noise scenarios.

There is one property that practical OFDM systems possess that makes them easy to detect even in negative-SNR scenarios:

OFDM in most cases (and especially WiFi) is CP-OFDM. That means that for synchronization and equalization purposes, every OFDM symbol starts with a "copy" of its own end, shifted to the front. (Of you haven't heard about that, you'll find it covered in every textbook that introduces OFDM, and you should definitively read up on it. To give you an idea: OFDM is based on the Discrete Fourier Transform, which makes the convolution of the transmit signal with the channel impulse response a multiplication, if, and only if, that convolution looked like a circular convolution to begin with; by having the CP, you emulate a circular convolution by the real-world linear convolution.)

You can exploit the CP by looking for peaks in the receive signal autocorrelation at exactly the symbol length. Since you really don't care about any other delay, you just calculate the dot product of a CP-length part of signal with signal delayed by an OFDM symbol length. If there's a peak there, you probably found a CP. To allow for a constant threshold, just divide the correlation coefficient by the product of powers in both segments.

OFDM symbol length and CP length are both defined by the WiFi standards.

A remark on the overall thing you're doing: you might end up never finding a good threshold. That's because WiFi is in an ISM band and relies on CSMA-CA, and you run into the classical hidden station problem. As long as you document that very well and give good reasons, it's absolutely legitimate to pick a threshold that simply gives you a fixed detection probability empirically. Notice that due to the aforementioned properties, it's pretty hard to tell SNR from SINR.
$\endgroup$
2
  • $\begingroup$ What does OFDM stand for? $\endgroup$
    – argentum2f
    Commented Oct 8, 2019 at 17:19
  • $\begingroup$ @argentum2f Orthogonal Frequency Division Multiplex(ing), the multicarrier scheme Wifi uses. It's a pretty common approach to broadband systems these days; you'd definitely want to read up on that! $\endgroup$ Commented Oct 8, 2019 at 19:03
1
$\begingroup$

I think the most straightforward basic approach to detecting noise/variance levels is:

highpass -> rectify (or square) -> lowpass

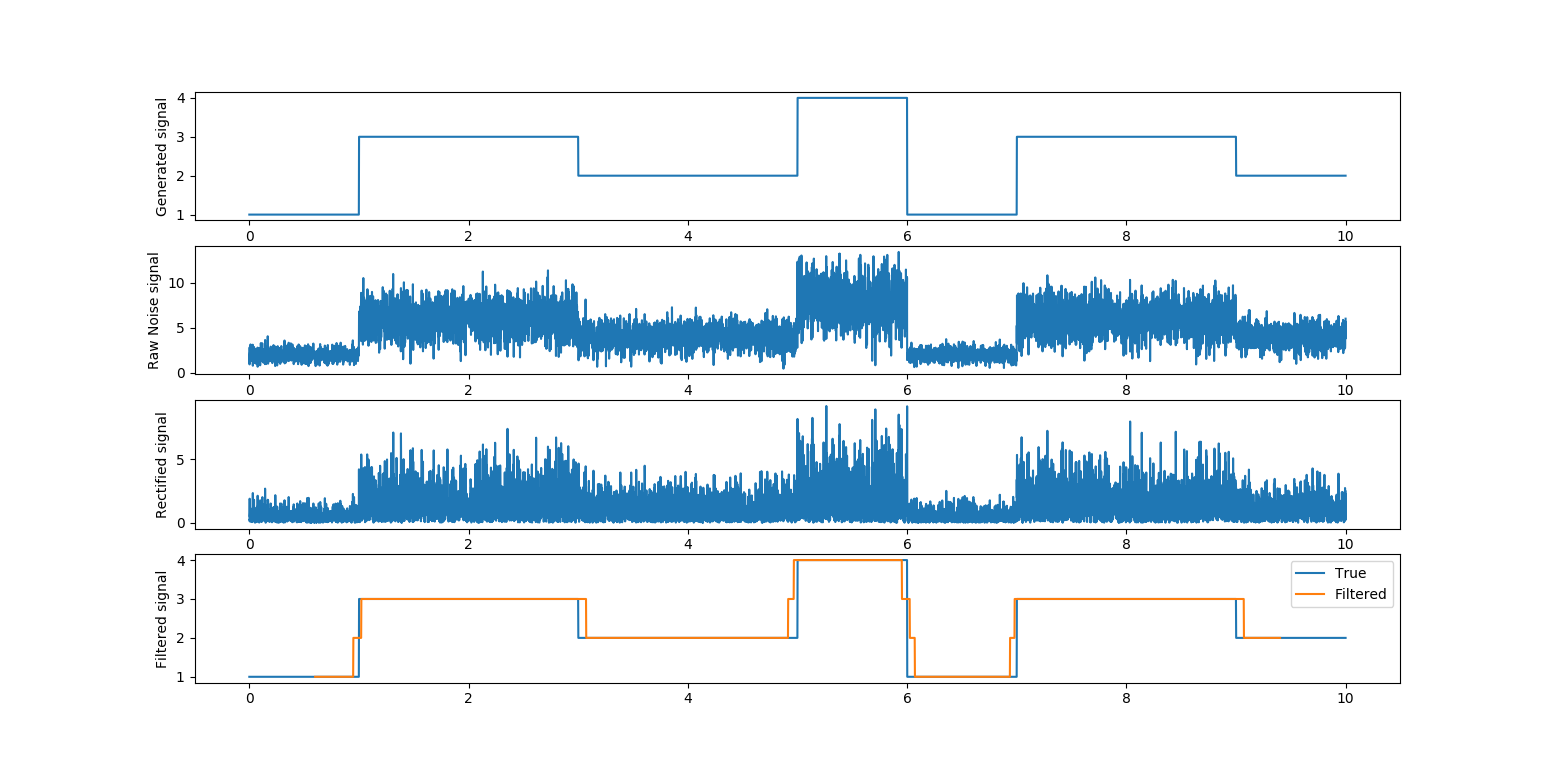
There are many types of 'highpass' or 'lowpass' like operations/filters that you can choose from and tune based on your application. Below I use diff (e.g. derivative) effectively as a highpass filter, and a couple rolling quantile filters for the lowpass part. Then I use round to discretize the levels.

import numpy as np                                                                                                   
import matplotlib.pyplot as plt                                                                                      
import pandas as pd                                                                                                  

# Generate test signal                                                                                               
np.random.seed(2)                                                                                                    
PN = 100 # Min points per pulse (i.e. min points expected for detection)                                             
N = 1000 # Total number of points for simulation                                                                     
x = np.linspace(0,N/PN,N)                                                                                            
noiseLevel = 1+x.astype(int)%2+x.astype(int)%3; # Fake function te generate various levels                           
ynoise = (np.random.normal(0,.5,*x.shape)+2)*noiseLevel # Normally distributed noise                                 
#ynoise = (np.random.random(*x.shape)*2-1 +2)*noiseLevel # Uniform distributed noise                                 

# Retrieve desired signal through rectification and filtering.                                                       
yfilt = np.abs(np.diff(ynoise, prepend=ynoise[1])) # diff (i.e. high pass filter), then rectify                   
yfiltR = yfilt.copy()                                                                                                
yfilt = pd.Series(yfilt).rolling(window=PN//5, center = True).quantile(.88)                                          
yfilt = pd.Series(yfilt).rolling(window=PN, center = True).quantile(.5)                                              
yfilt = np.round(yfilt)                                                                                              

# Plot                                                                                                     
plt.figure(1); plt.clf()                                                                                             
plt.subplot(4,1,1)                                                                                                   
plt.plot(x, noiseLevel)                                                                                              
plt.ylabel('Generated signal')                                                                                       
plt.subplot(4,1,2)                                                                                                   
plt.plot(x, ynoise)                                                                                                  
plt.ylabel('Raw Noise signal')                                                                                       
plt.subplot(4,1,3)                                                                                                   
plt.plot(x, yfiltR)                                                                                                  
plt.ylabel('Rectified signal')                                                                                       
plt.subplot(4,1,4)                                                                                                   
plt.plot(x, noiseLevel, label = 'True')                                                                              
plt.plot(x, yfilt, label = 'Filtered')                                                                               
plt.legend()                                                                                                         
plt.ylabel('Filterd signal')                                                                                         
plt.show()  

enter image description here

Note 1: A rolling mean with a small window, followed by a rolling max with a larger window gives similar behavior to the first rolling quantile. The second quantile is just a median filter. Using efficient mean/median/max filters (e.g. bottleneck.move_median) might be much faster.

Note 2: Depending on how your noise is distributed (in magnitude and frequency) you need to tune the quantile thresholds and window sizes.

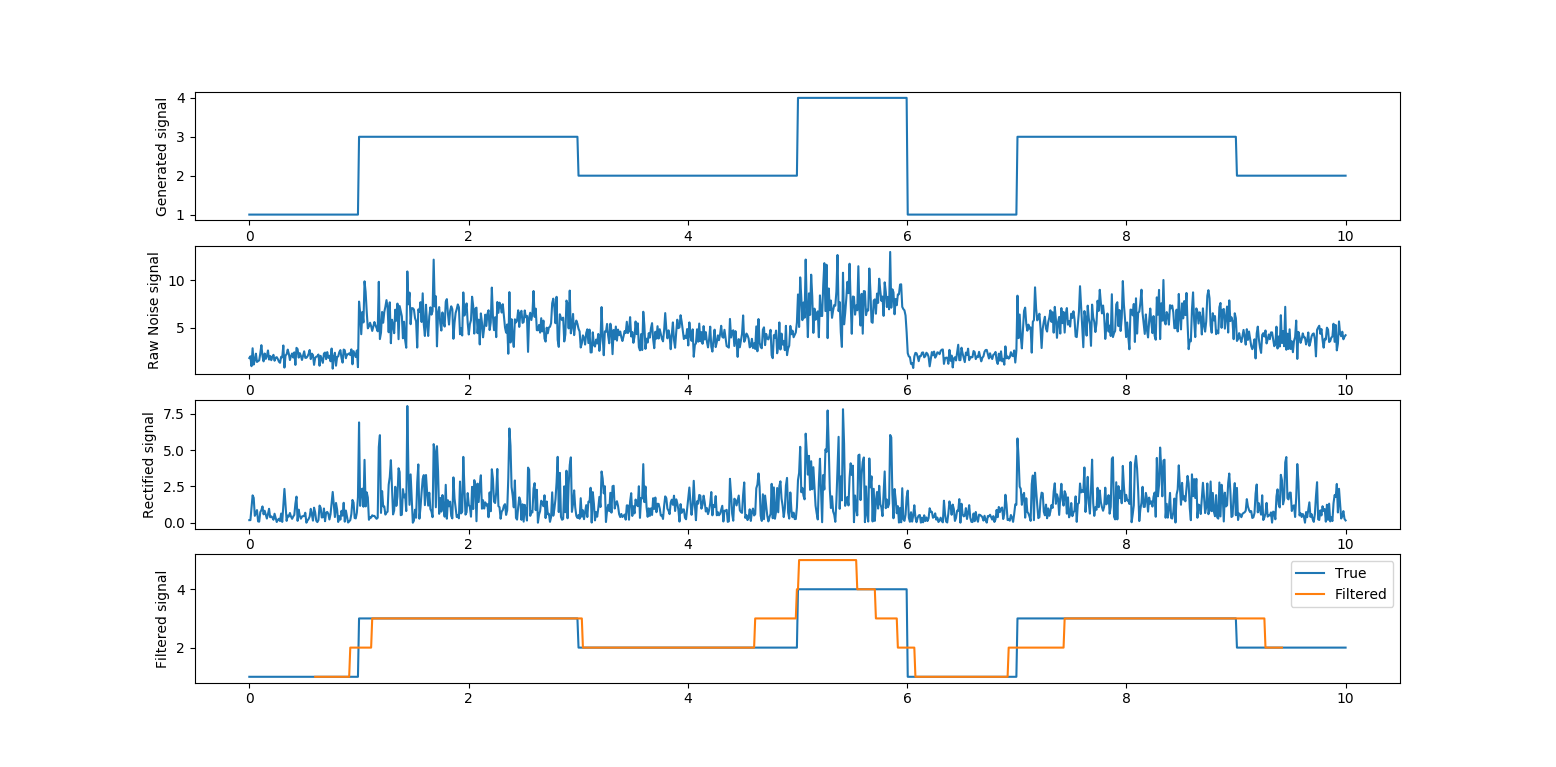
Note 3: Since this relies on good statistics, results are going to get worse with fewer points to sample. For example, the following is with PN=100 enter image description here

$\endgroup$

Your Answer

By clicking “Post Your Answer”, you agree to our terms of service and acknowledge you have read our privacy policy.

Not the answer you're looking for? Browse other questions tagged or ask your own question.