1
$\begingroup$

I have been reading about equalization and channel estimation in order to apply to my application of estimating trajectory path for a two-wheeled robot. The application is quite similar to equalization. I am studying the Least Mean Square algorithm (LMS) and have some basic doubts regarding how to determine if equalization is proper or not i.e., if there is a measure to quantify how much of the signal has been estimated properly. I am following this MATLAB implementation.

  • Doubt 1 :

    The cost function for LMS is constructed using the input, so we are minimizing the error function. So, based on my understanding the input is known to the receiver. Hence, the LMS equalizer is not blind. Please correct me if wrong.

  • Doubt2:

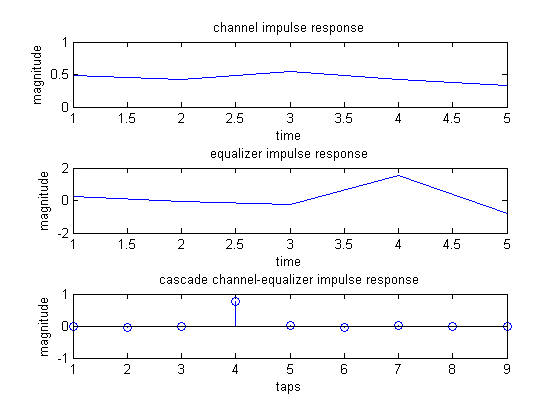
    On running the code (using the same parameter settings in the code), I cannot understand what is the significance of the fourth tap having a magnitude one. Is this the delta impulse in the third subplot.

image

Does having a delta function mean that equalization is correct? I had read that for equalization to happen, the convolution of the estimated channel coefficients (here these are the weights of the LMS) and the known channel impulse should be a delta function. Does this graph convey the same? Could somebody please explain this concept of delta impulse and the graph?

$\endgroup$

1 Answer 1

1
$\begingroup$

You're right. LMS equalizer uses a known input to minimize the error. For communication purposes, this is either provided by a training sequence, or in a decision directed mode, the detector decisions are fed back as known data.

The delta function is also correct. Suppose that the channel impulse response is $h(t)$ and frequency response $H(f)$. Then the equalizer should ideally be the inverse of this function in frequency domain (remember the convolution in time domain and hence multiplication in frequency domain). $$H(f)\cdot \frac{1}{H(f)} = 1$$ and its inverse Fourier transform is $$F^{-1}(1) = \delta (t)$$

The fourth tap being 1 implies that there is a delay of 4 symbols with respect to your time base at the Rx. Finally, to further verify your results, plot the frequency responses of the channel and the equalizer response, and you will see an approximately inverse relationship.

$\endgroup$
8
  • $\begingroup$ Thank you for your reply. I still have doubts regarding the impulse response concept. Could you please clarify these points? (1)In the code, the input is filtered through a channel modeled as FIR :filter(c,1,u) where $c$ is the channel coefficients, $u$ is the input. The order is M=5. So, does this mean that there are 4 delays, hence the fourth tap =1? (2) In the first sub-plot, why is the third point higher? (3) What is the difference between the second sub-plot and third sub-plot? and lastly $\endgroup$
    – Ria George
    Commented Jun 11, 2017 at 21:52
  • $\begingroup$ (1) No. The 4th tap is 1 because the code is written in a way that the Rx time base is 4 taps behind this delta function. Remember there are 2 convolution, first of data with channel and second, of this Rx input with equalizer. So don't worry about the tap being 4 or not. Just remember that convolution of two signals with lengths $L_1$ and $L_2$ is $L_1+L_2-1$. $\endgroup$
    – QMC
    Commented Jun 12, 2017 at 4:41
  • $\begingroup$ (2) 3rd point is higher because the energy in channel impulse response is distributed in a way that the 3rd tap is stronger than the 2nd tap (remember that each tap contains energy from several multipath components, so it is possible to receiver more energy in 3rd tap as compared to the 2nd tap). $\endgroup$
    – QMC
    Commented Jun 12, 2017 at 4:42
  • $\begingroup$ (3) the 2nd subplot is equalizer impulse response only, something if you knew, you would store in your Rx memory to filter the incoming Rx signal with, while the 3rd subplot is convolution of channel impulse response with equalizer coefficients, the result of which should be a delta function as you can see in my answer above. (4) Yes, the 3rd subplot is showing that ISI is very small due to the cascade response being a delta function. It was possible to have energy at other points of this result, whose magnitude squared would have given you the ISI. $\endgroup$
    – QMC
    Commented Jun 12, 2017 at 4:45
  • 1
    $\begingroup$ I meant that ideally it should be a delta function; here in 3rd plot, it is approximately a delta function. Hope it clarifies. $\endgroup$
    – QMC
    Commented Jun 12, 2017 at 6:00

Your Answer

By clicking “Post Your Answer”, you agree to our terms of service and acknowledge you have read our privacy policy.

Not the answer you're looking for? Browse other questions tagged or ask your own question.