2
$\begingroup$

I am a physics graduate student studying a new physical device via simulations. Thanks to SE DSP, reading Lyon's Understanding DSP as suggested (not all the way through it yet though), and a bunch of work, I have been learning, and enjoying, DSP. I’m at a point where I am completely stumped by something, and need some help.

For this project, signal processing appears very simple, as seen in this diagram: enter image description here However, what happens inside the "Physics Device" somewhat complicated. Simply put, when the external signal $f(t)$ and the physics device interact, there is some destructive interference. To me, this means there will be a narrow low frequency spike at the time where there is interference. When there is no destructive interference, there is a lot of stuff going on. The outputs relating to the physical device are very ugly compared to a communication system; there are many harmonics and other things happening.

When the physical device I'm simulating is running, and an external microwave signal $f(t)=A\cos(\omega_1 t +\phi_1)+B\cos(\omega_2 t + \phi_1)$ is introduced, destructive interference creates some low frequency oscillations at particular locations:

Input #1: $f(t)=A\cos(\omega_1 t +\phi_1)+B\cos(\omega_2 t + \phi_1)$

Output #1:

signal1 Raw and LP

Th upper graph shows raw data, and the lower shows this after I apply a Low pass filter. If I use a low-pass FIR filter near DC, it gives me nice peaks to identify where the low frequency oscillations occur.

In these, the first peak near $60\textrm{ ns}$ is related to the first term, and the second smaller peak near $100\textrm{ ns}$ is related to the second term. Also, $B=0.2A$, so the second peak should be shorter than the first peak.

If instead of phase shift $\phi_1$ in the first term, the signal has a phase shift of $\phi_2$, or as: $f(t)=A\cos(\omega t + \phi_2) +B\cos(\omega_2 t + \phi_1)$, we get similar looking raw data:

Input #2: $f(t)=A\cos(\omega_1 t +\phi_2)+B\cos(\omega_2 t + \phi_1)$

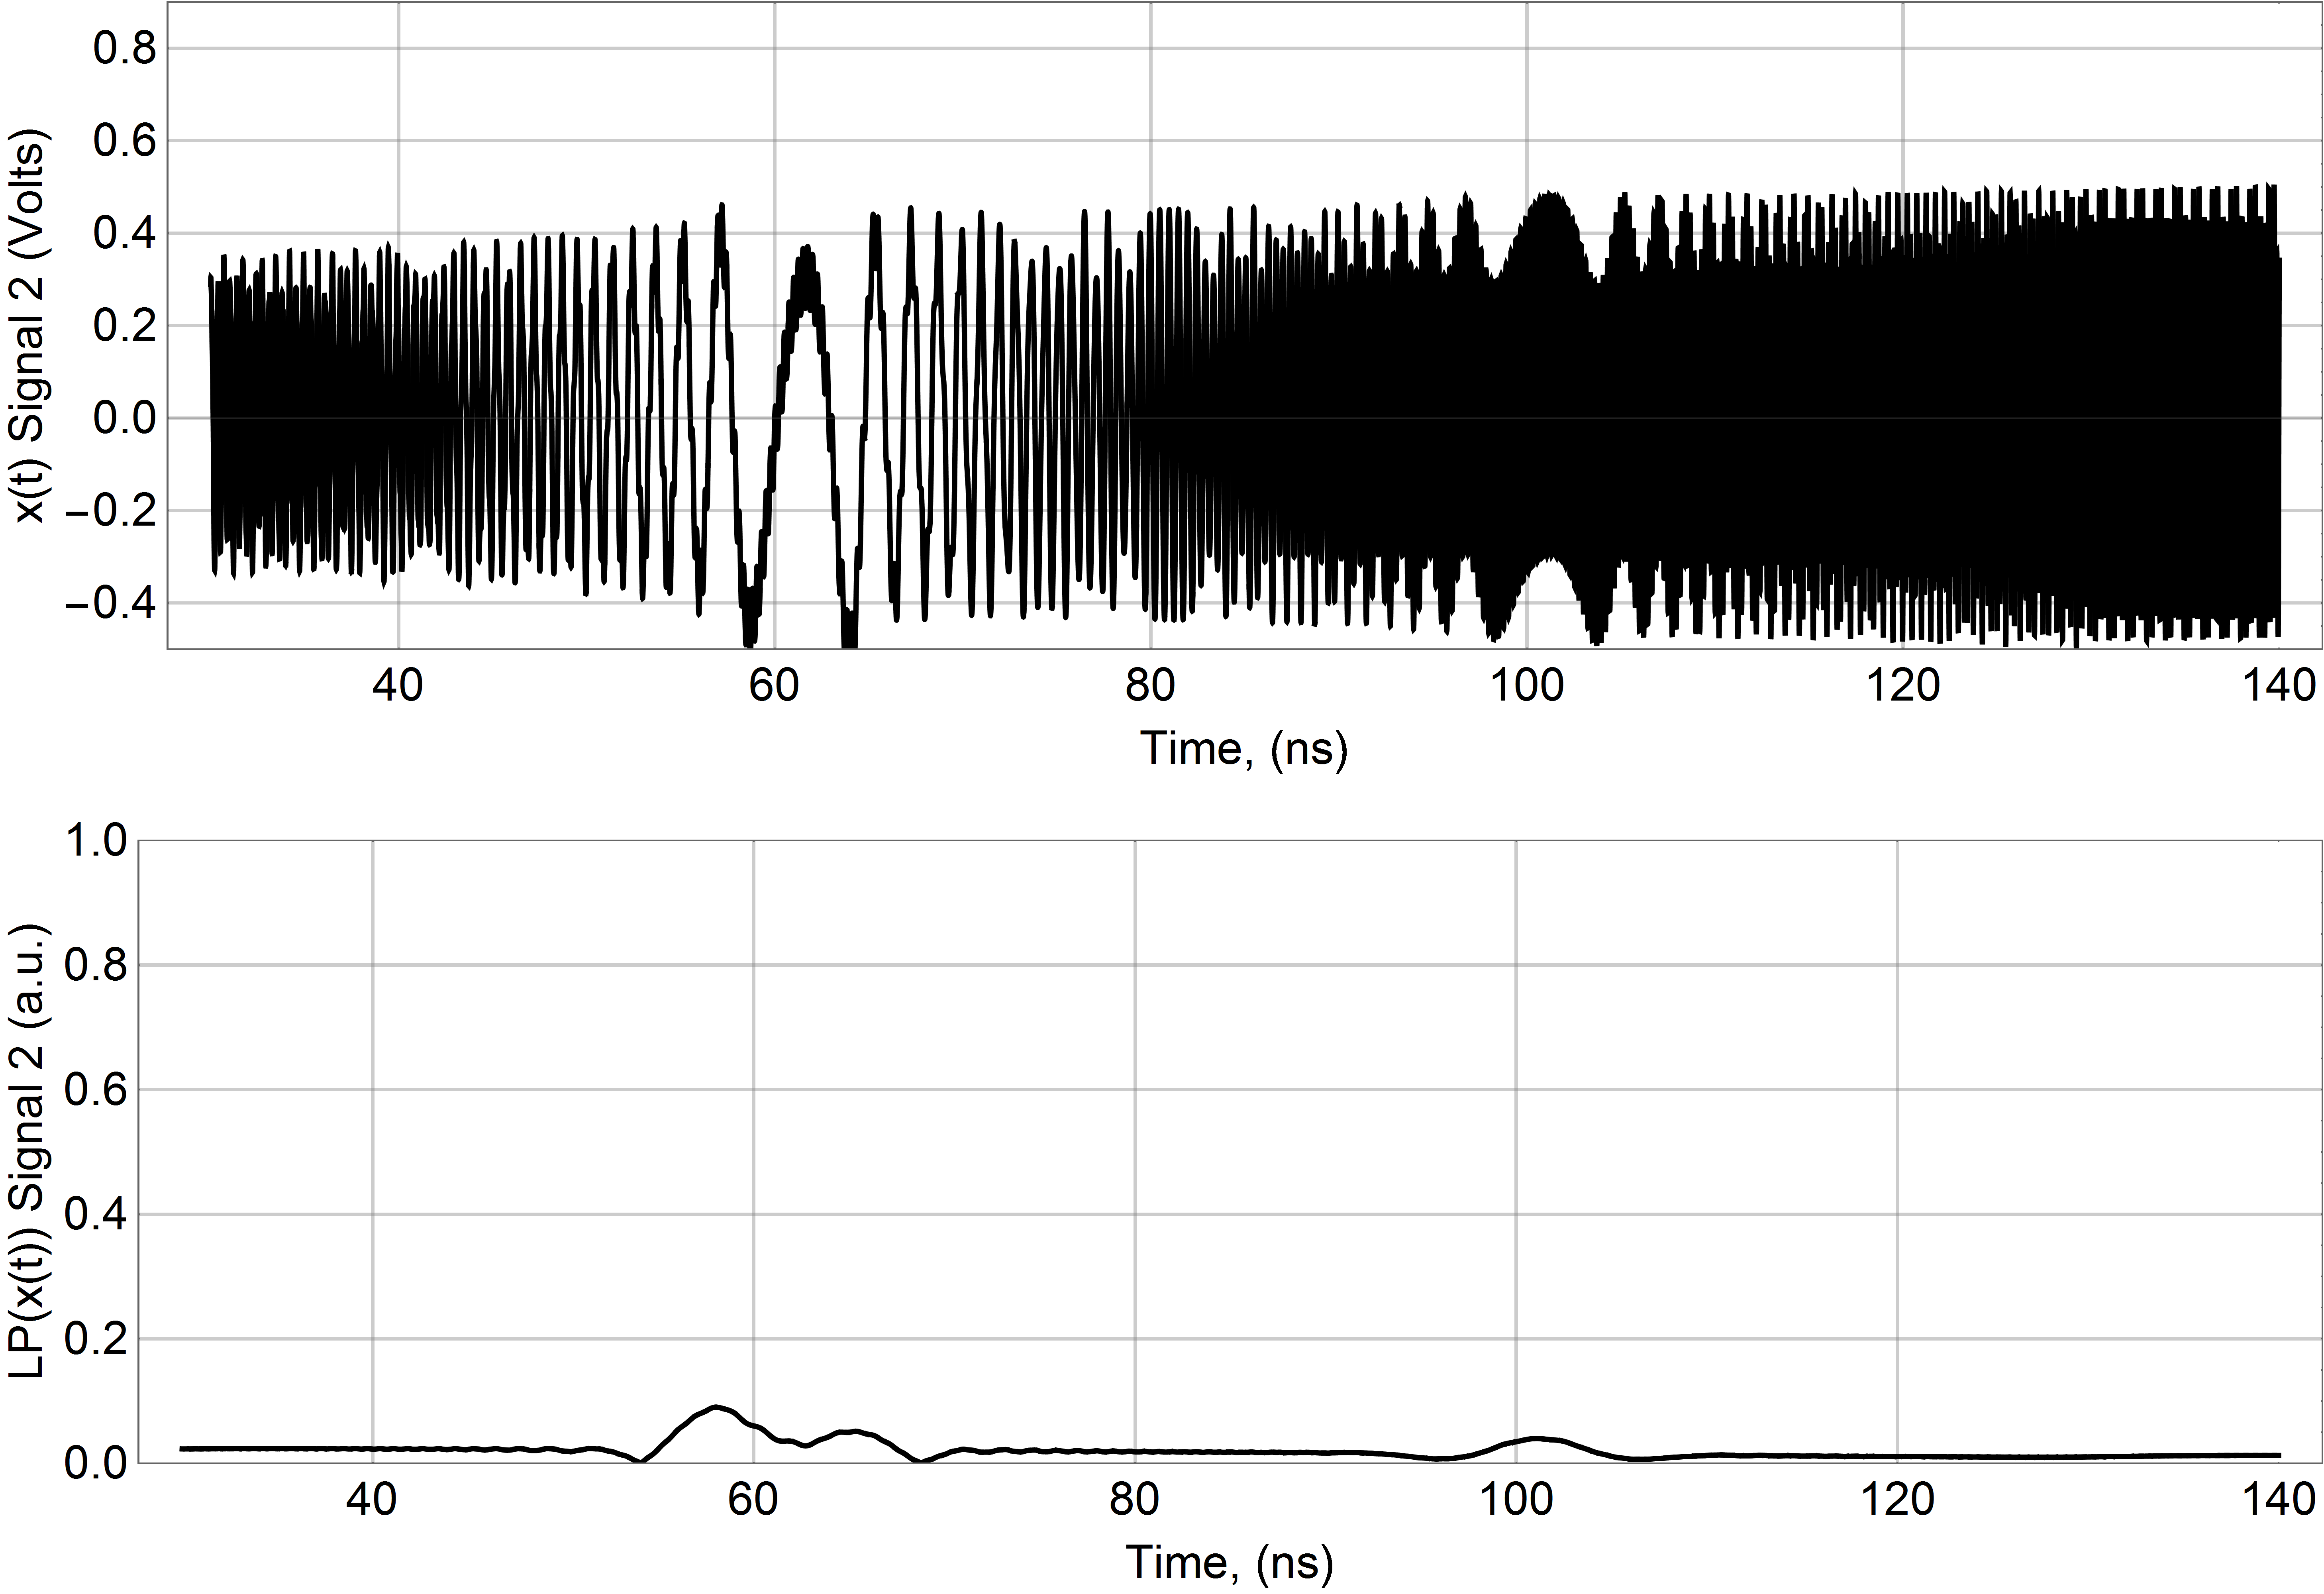
Output #2:

Weaker Signal

But after the low pass filter, the peaks are not-so-beautiful.

Is there an algorithm that will allow me to determine when an external signal is introduced into the physical system regardless of the initial phase shift of the external signal? My eyes can identify from the raw data where the peaks should be, but a low pass filter doesn’t do the job consistently.

I have tried using signal energy, as $\int_t^{t+T} \lvert x(t’)\rvert^2 dt’$, but this fails in two regards.

  1. It does not see the second peak
  2. And it requires some threshold, which doesn’t work well as $A$ and $B$ can differ by several orders of magnitude.

Is there a good algorithm to get nice thin peaks from both signals? Even more, is it something that can be built with existing technology?

I can post data for the above graphs. How can I post it? They are small lists, with ~ 100,000 elements.

$\endgroup$
5
  • $\begingroup$ Post a dropbox link if you have one. $\endgroup$ Commented Jun 2, 2016 at 3:21
  • $\begingroup$ Raw Data Set 1 which has 1000 samples/ns. $\endgroup$ Commented Jun 2, 2016 at 4:08
  • $\begingroup$ Raw Data Set 2 which has the same sampling rate. $\endgroup$ Commented Jun 2, 2016 at 4:09
  • $\begingroup$ The data does not look like added sine waves to me. Are you sure that model is correct? $\endgroup$
    – Peter K.
    Commented Jun 6, 2016 at 1:59
  • $\begingroup$ @PeterK. Good question. The data has a pure sinusoidal input, and a messy output. I have added a block diagram and more explanation. $\endgroup$ Commented Jun 6, 2016 at 9:01

2 Answers 2

1
$\begingroup$
  1. I would use a band-pass filter centred at the frequency of the peaks (10ns period?). That should give you more of a peak in the second signal.

  2. Use a quadrature filter pair (band-pass filter and its Hilbert transform) to gain phase invariance. The output is called the analytic signal. Its amplitude is a local phase-invariant energy measure.

In MATLAB this would be

f_a = hilbert(conv(f,g,'same'));
amplitude = abs(f_a);
phase = angle(f_a);

where f is the signal and g is the band-pass filter.

$\endgroup$
6
  • $\begingroup$ Thanks for your response. One issue is that the external frequency and phase in this research are unknown- they can be anywhere in a 10 GHz bandwidth. $\endgroup$ Commented Jun 2, 2016 at 3:39
  • $\begingroup$ I will read about the quadrature filter pair. Will it work with a low-pass filter too? $\endgroup$ Commented Jun 2, 2016 at 3:39
  • $\begingroup$ @axsvl77 Not quite, the Hilbert transform has a discontinuity at DC. Although you can use a low pass filter by simply setting the mean of the signal to 0 f = (f - mean(f)); $\endgroup$ Commented Jun 2, 2016 at 6:47
  • $\begingroup$ Ah! Cool. So modulate to a higher frequency, then quadrature filter pair. Reading about it now. Very cool. Can't wait to try it. $\endgroup$ Commented Jun 2, 2016 at 9:46
  • $\begingroup$ Unfortunately, it doesn't work; it seems my signals are a little more complicated than they seem at first glance. I tried a few things, using the hilbert transform with the low-passed with DC removed, and modulating to a higher frequency, band-pass, then hilbert. It has an interesting effect on the phase, but the signal is not improved at all. What else can I do? $\endgroup$ Commented Jun 3, 2016 at 6:29
1
$\begingroup$

I don't see how the signal you're displaying is the sum of two sine waves. Have you tried an FFT to show this? My gut says that you are mixing (multiplying) two or more signals here, and the result looks like a swept sine plus a constant frequency sine--like tuning an old superhet radio and looking at the output from the mixer. You may want to try mixing them both to a lower frequency (downconversion) and then one or two phase-locked loops to indicate either when the signals appear and/or their frequencies (which will be offset by your downconversion from their true frequencies). The phase sensitivity can be avoided by mixing with both I and Q (90* phase-shifted) versions of your swept interrogator, then summing the squared outputs.

$\endgroup$
3
  • $\begingroup$ What makes you think the output is the sum of two sine waves? I'd like to clarify my question. $\endgroup$ Commented Jun 7, 2016 at 21:55
  • $\begingroup$ @axsvl77 : Before you introduced the diagram, that was my assumption too: that you were saying your measured signal was the sum of two sinusoids. Clearly, it's not, but that was only cleared up with the diagram. $\endgroup$
    – Peter K.
    Commented Jun 7, 2016 at 22:40
  • $\begingroup$ @PeterK. I have tried to make it a little more clear. $\endgroup$ Commented Jun 7, 2016 at 23:53

Your Answer

By clicking “Post Your Answer”, you agree to our terms of service and acknowledge you have read our privacy policy.

Not the answer you're looking for? Browse other questions tagged or ask your own question.