0
$\begingroup$

I have simulation data in the time domain and I need to represent them in the frequency domain.

The data have been obtained time integrating the following equation:

$m \ddot{x} + c\dot{x} + kx = A \sin{(\phi(t))}$

where $\sin{(\phi(t))}$ represents a logarithmic chirp. Therefore, since also the integrated time histories are chirps, I cannot use the FFT to transform them in the frequency-domain, but I have to do something like it was done in this answer: system response: time vs frequency. Why do I get different magnitudes?

Therefore I used the spectrogram in this way:

% Resample at a constant sampling frequency
dt = 0.0001;
t0 = time(1);
tend = time(end);
new_t = t0:dt:tend;
Fs = 1/dt;

acce_TS = timeseries(acce_cog,time);
acce_res = resample(acce_TS,new_t);

% Spectrogram
win = hamming(256);
noverlap = 0;
nfft = 512;
X = abs(spectrogram(acce_res.data, win, noverlap, nfft,Fs));
X = 2*X/sum(win);
surf(X)

And here come the problems:

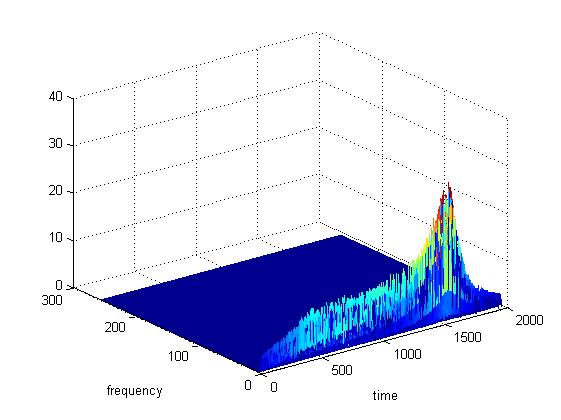
1) On the time axis I have wrong values: the time history lasts $49.5 \ s$ whereas in the spectrogram plot I see values from 0 to 2000

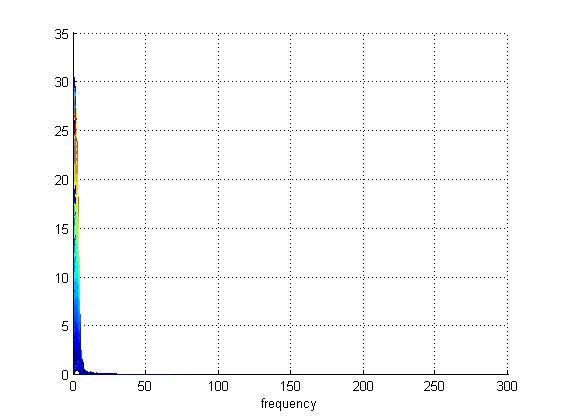
2) The peak response should be at nearly $30 Hz$ (which is the resonance frequency of the system, given as $f_n = \sqrt{k/m}$), whereas from the spectrogarm I see it at nearly $5 Hz$

3) The amplitude of the peak of the spectrogram is a bit higher than in the time history

4) I actually need to see only the frequency-amplitude plot, not the 3D representation, so how can I do that? At the moment I am using view([90 0]), but is there a way to plot directly the 2D plot?

EDIT: Here the plots
$\endgroup$
8
  • $\begingroup$ You can use contourf to view a flattened 2D image $\endgroup$
    – johnnymopo
    Commented Nov 27, 2015 at 16:26
  • $\begingroup$ Check your time and frequency data using Parseval's theorem $\endgroup$
    – johnnymopo
    Commented Nov 27, 2015 at 16:28
  • $\begingroup$ The contourf gives the xy plot and the colormap refers to the z right? So, if I am not mistaken, in my case I will have the time-frequency plot and the colormap will give the amplitude. But what I need is the yz plot, so frequency-amplitude $\endgroup$
    – Rhei
    Commented Nov 27, 2015 at 19:36
  • $\begingroup$ I tried the check fro Parseval's theorem, therefore I computed: Et = norm(acce_res.data).^2 which gives 2.3430e+7 and Ef = nrom(X).^2 (before dividing it by sum(win)) and it gives 2.6687e+009. So something is wrong $\endgroup$
    – Rhei
    Commented Nov 27, 2015 at 19:42
  • $\begingroup$ Hmm, why norm? You need to sum energy $\endgroup$
    – johnnymopo
    Commented Nov 27, 2015 at 19:45

2 Answers 2

0
$\begingroup$

1) On the time axis I have wrong values: the time history lasts 45 s whereas in the spectrogram plot I see values from 0 to 2000

RTFM on surf. You'll need to do something like surf(new_t,new_f,X) instead of just surf(X). Your new_f should be something like

new_f = linspace(0,Fs/2,256);

NOTE: I don't have access to matlab, and am not sure of the orientation of X. You may have to swap the parameter locations of new_t and new_f on surf.

4) I actually need to see only the frequency-amplitude plot, not the 3D representation, so how can I do that? At the moment I am using view([90 0]), but is there a way to plot directly the 2D plot?

Do something like:

plot(new_t, max(X));

You may have to do max(X') instead, depending on the orientation of X.

I'll need to think about answers to 2 & 3. Watch this space.

$\endgroup$
2
  • $\begingroup$ I tried plotting surf(new_t,new_f,X) but the dimensions do not match: X is 257x1951 whereas new_t is 1x499540 and new_f is 1x257, so the problem is new_t. The suggestion about the 2D plot works perfectly :) $\endgroup$
    – Rhei
    Commented Nov 27, 2015 at 19:51
  • $\begingroup$ I just noted that 499540/256 = 1951 so I think the problem with the dimensions comes from the windowing $\endgroup$
    – Rhei
    Commented Nov 27, 2015 at 20:05
0
$\begingroup$

Check this video for detail explanation--> Frequency Response of Chirp Signal -Eye of Sauron(The Lord of the Rings)

$\endgroup$

Your Answer

By clicking “Post Your Answer”, you agree to our terms of service and acknowledge you have read our privacy policy.

Not the answer you're looking for? Browse other questions tagged or ask your own question.