1
$\begingroup$

I have a range of songs where I have took an 'unfolded' chromagram computed from a series of short-term windows. Specifically, for one song, I have one vector which contains the amplitudes of the chroma's, and a second vector which contains the corresponding MIDI notes. For now, I can plot a histogram of the amplitudes w.r.t the MIDI notes that gives me a visual idea of the range of notes used.

Here are two songs graphed:

graphs

As we can see, the 'classical' example is in my opinion more sparse than its neighbouring graph. I've been trying to figure out a way as to how to measure for something like this, since I need to fold such a feature vector into 1 useful statistic.

$\endgroup$
3
  • $\begingroup$ Probably you can use sparsity as a useful statistic. The sparsity of a vector is the number of non-zero components of the vector. It is denoted mathematically using $L_0$-norm which is popular in sparse representation and in compressed sensing. For example, if $x=[1 0 0 -1 2.3 0 0 0 0 1 0 0 0 0]$, which of length $N=14$, its sparsity is, that is, $L_0$-norm is $\|x \|_0=4$. It is a 4-sparse vector. $\endgroup$
    – Oliver
    Commented Jun 13, 2015 at 1:08
  • $\begingroup$ Sorry there some notation error in the above comment. The $$x=\left[1~0~ ~0~-1~2.3~0~0~0~0~1~0~0~0~0~\right]$$ $\endgroup$
    – Oliver
    Commented Jun 13, 2015 at 1:28
  • $\begingroup$ Thanks for the advice, I'll look into it this and let you know how I get on. $\endgroup$ Commented Jun 16, 2015 at 8:41

2 Answers 2

1
$\begingroup$

I am considering a similar problem as well and I found Gini index as one of the solution: Gini Index as Sparsity Measure for Signal Reconstruction from Compressive Samples. Please have a look at the definition in page 3. It is normalized in the range from 0 to 1 as the least sparse or the most sparse the vector is, respectively.

The code below is an implementation in Python, though I am not sure about returning 0 if the input is a zero vector:

def gini(v):
    v = np.array(v)
    sort_v = sort(abs(v))
    norm_v = sum(sort_v)
    if norm_v==0:
        return(0)
    else:
        sig = 0 
        for k in arange(len(sort_v))+1:
            sig+=(sort_v[k-1]/(norm_v))*((len(sort_v)-k+0.5)/len(sort_v))
        return(1-2*sig)
$\endgroup$
1
$\begingroup$

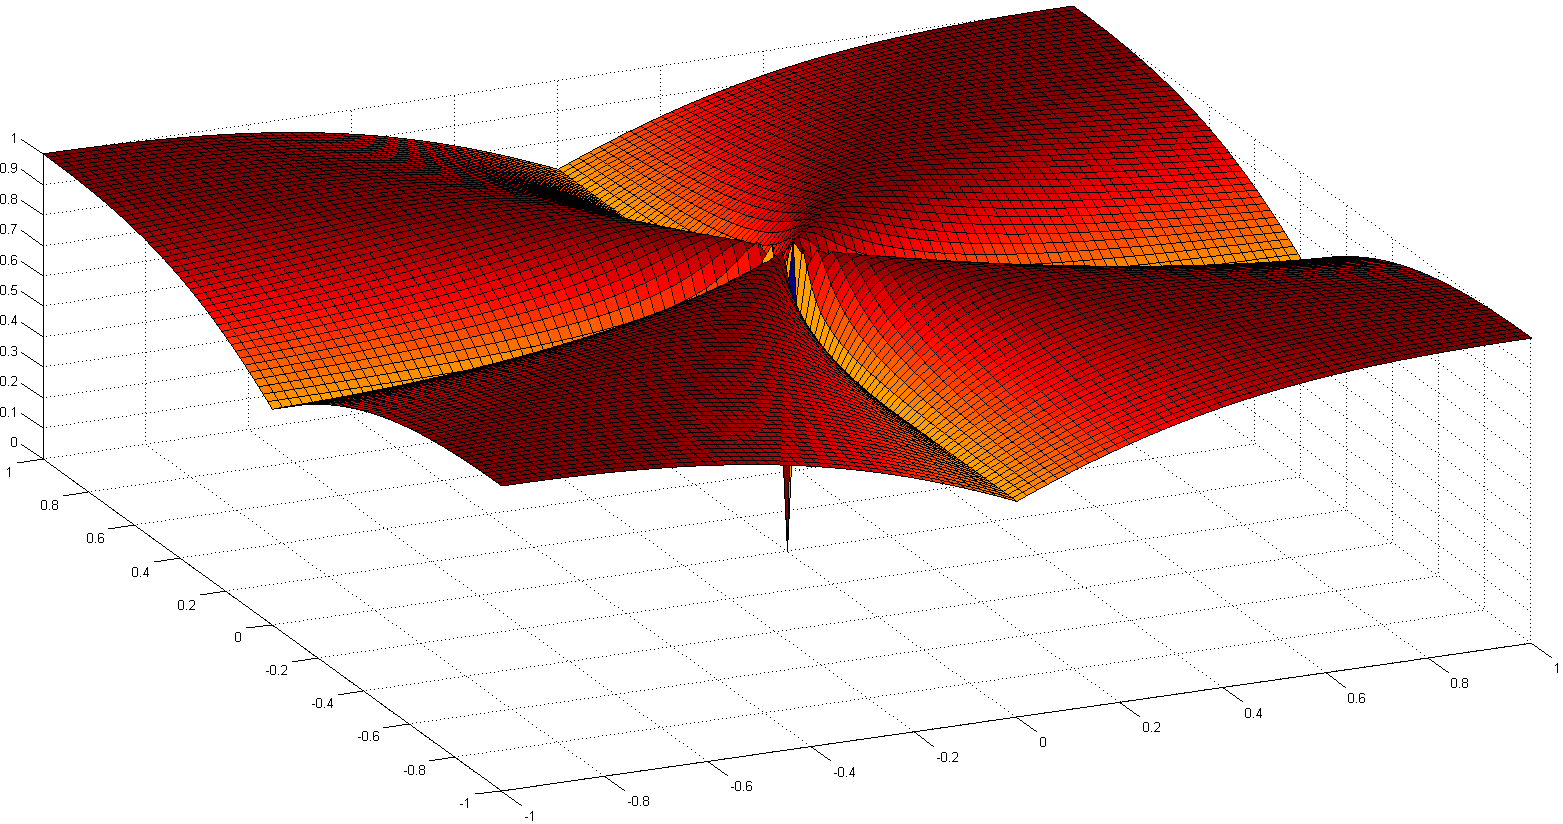
In Comparing Measures of Sparsity, 2009, IEEE Trans. Information Theory, an axiomatic characterization of sparsity for random sources, and a comparison of different measures is provided. Two measures emerged (in my reading): the Gini index or coefficient, as proposed above, and the $\ell_1/\ell_2$ norm ratio, illustrated below.

enter image description here

It stems from a standard norm inequality between $\ell_1$ and $\ell_2$ ($\ell_2 \le \ell_1 \le \sqrt{n}\ell_2$, with $n$ the length of the signal, through Cauchy-Schwarz or Hölder inequality), that saturates on both ends for:

  • the nonzero-constant signal,
  • the all-zero-but-one signal,

and being scale-invariant, zero-homogeneous (as the Gini index or the $\ell_0$ counting index).

While the Gini index seems the more natural, the second one can be used more easily in subsequent processing, for instance restoration, as it provides a computable non-convex penalty. For a recent paper with an historical account for the norm ratio: Euclid in a Taxicab: Sparse Blind Deconvolution with Smoothed $\ell _1/\ell _2$ Regularization, 2015, IEEE Signal Processing Letters.

A Matlab code is given below:

function mos_l1_l2 = MoS_Hoyer_ratio_l1_l2(data)

if isequal(data,0)
  mos_l1_l2 = 0;
else
  mos_l1_l2 = sum(abs(data))./sqrt(sum((data).^2));
end
$\endgroup$

Your Answer

By clicking “Post Your Answer”, you agree to our terms of service and acknowledge you have read our privacy policy.

Not the answer you're looking for? Browse other questions tagged or ask your own question.