9
$\begingroup$

I have two spectra of the same astronomical object. The essential question is this: How can I calculate the relative shift between these spectra and get an accurate error on that shift?

Some more details if you are still with me. Each spectrum will be an array with an x value (wavelength), y value (flux), and error. The wavelength shift is going to be sub-pixel. Assume that the pixels are regularly spaced and that there is only going to be a single wavelength shift applied to the entire spectrum. So the end answer will be something like: 0.35 +/- 0.25 pixels.

The two spectra are going to be a lot of featureless continuum punctuated by some rather complicated absorption features (dips) that do not model easily (and are not periodic). I'd like to find a method that directly compares the two spectra.

Everyone's first instinct is to do a cross-correlation, but with subpixel shifts, you're going to have to interpolate between the spectra (by smoothing first?) -- also, errors seem nasty to get right.

My current approach is to smooth the data by convolving with a gaussian kernel, then to spline the smoothed result, and compare the two splined spectra -- but I don't trust it (especially the errors).

Does anyone know of a way to do this properly?

Here is a short python program that will produce two toy spectra that are shifted by 0.4 pixels (written out in toy1.ascii and toy2.ascii) that you can play with. Even though this toy model uses a simple gaussian feature, assume that the actual data cannot be fit with a simple model.

import numpy as np
import random as ra
import scipy.signal as ss
arraysize = 1000
fluxlevel = 100.0
noise = 2.0
signal_std = 15.0
signal_depth = 40.0
gaussian = lambda x: np.exp(-(mu-x)**2/ (2 * signal_std))
mu = 500.1
np.savetxt('toy1.ascii', zip(np.arange(arraysize), np.array([ra.normalvariate(fluxlevel, noise) for x in range(arraysize)] - gaussian(np.arange(arraysize)) * signal_depth), np.ones(arraysize) * noise))
mu = 500.5
np.savetxt('toy2.ascii', zip(np.arange(arraysize), np.array([ra.normalvariate(fluxlevel, noise) for x in range(arraysize)] - gaussian(np.arange(arraysize)) * signal_depth), np.ones(arraysize) * noise))
$\endgroup$
4
  • $\begingroup$ If I understand correctly the problem sounds similar to image registration, except you just have a linear sub-pixel shift in one axis. Maybe try standard image registration techniques such as phase correlation ? $\endgroup$
    – Paul R
    Commented May 14, 2012 at 10:54
  • $\begingroup$ If you have a pure delay in one signal (i.e. the shift in the wavelength parameter that you speak of), you might be able to exploit the Fourier transform property that turns the time delay into a linear phase offset in the frequency domain. This could work if the two samples aren't corrupted by different measurement noise or interference. $\endgroup$
    – Jason R
    Commented May 14, 2012 at 13:36
  • 1
    $\begingroup$ This thread may be useful- dsp.stackexchange.com/questions/2321/… $\endgroup$
    – Jim Clay
    Commented May 14, 2012 at 16:21
  • 1
    $\begingroup$ Do you have actual data to test with? The noise value you gave is too much for the cross-correlation to be sub-sample accurate. This is what it finds with several runs of noise 2.0 and offset 0.7 (= 1000.7 on the plot's x-axis), for instance: i.sstatic.net/UK5JD.png $\endgroup$
    – endolith
    Commented May 14, 2012 at 23:57

1 Answer 1

5
$\begingroup$

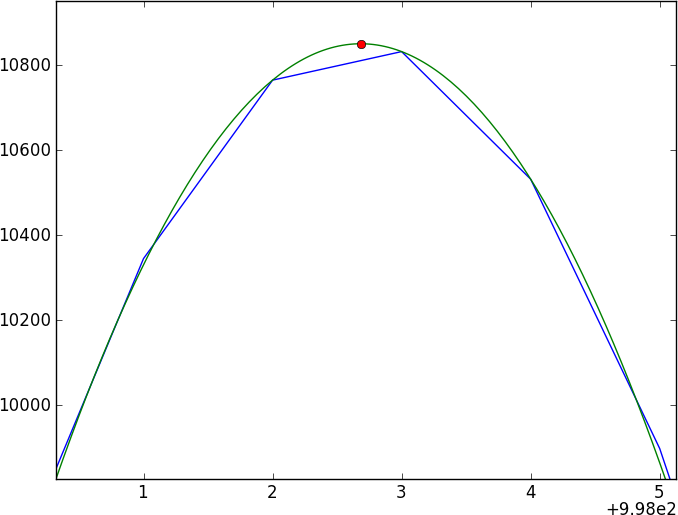
I think using cross-correlation and interpolating the peak would work fine. As described in Is up-sampling prior to cross-correlation useless?, interpolating or upsampling before the cross-correlation doesn't actually get you any more information. The information about the sub-sample peak is contained in the samples around it. You just need to extract it with minimal error. I gathered some notes here.

The simplest method is quadratic/parabolic interpolation, which I have a Python example of here. It's supposedly exact if your spectrum is based on a Gaussian window, or if the peak happens to fall exactly on the midpoint between samples, but otherwise has some error. So in your case you probably want to use something better.

Here is a list of more complicated, but more accurate estimators. "Of the above methods, Quinn's second estimator has the least RMS error."

I don't know the math, but this paper says that their parabolic interpolation has theoretical accuracy of 5% of the width of an FFT bin.

Using FFT interpolation on the cross-correlation output does not have any bias error, so that's the best if you want really good accuracy. If you need to balance accuracy and computation speed, it's recommended to do some FFT interpolation and then follow it with one of the other estimators to get a "good enough" result.

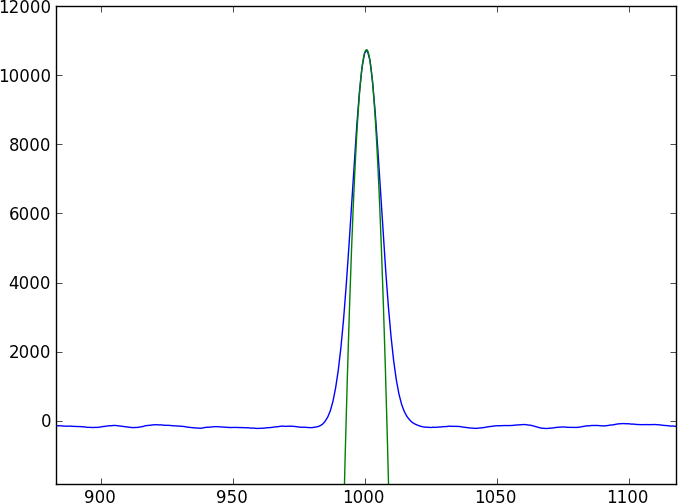
This just uses the parabolic fit, but it outputs the right value for the offset if the noise is low:

def parabolic_polyfit(f, x, n):
    a, b, c = polyfit(arange(x-n//2, x+n//2+1), f[x-n//2:x+n//2+1], 2)
    xv = -0.5 * b/a
    yv = a * xv**2 + b * xv + c

    return (xv, yv)

arraysize = 1001
fluxlevel = 100.0
noise = 0.3 # 2.0 is too noisy for sub-sample accuracy
signal_std = 15.0
signal_depth = 40.0
gaussian = lambda x: np.exp(-(mu-x)**2/ (2 * signal_std))
mu = 500.1
a_flux = np.array([ra.normalvariate(fluxlevel, noise) for x in range(arraysize)] - gaussian(np.arange(arraysize)) * signal_depth)
mu = 500.8
b_flux = np.array([ra.normalvariate(fluxlevel, noise) for x in range(arraysize)] - gaussian(np.arange(arraysize)) * signal_depth)

a_flux -= np.mean(a_flux)
b_flux -= np.mean(b_flux)

corr = ss.fftconvolve(b_flux, a_flux[::-1])

peak = np.argmax(corr)
px, py = parabolic_polyfit(corr, peak, 13)

px = px - (len(a_flux) - 1)
print px

enter image description here enter image description here

The noise in your sample produces results that vary by more than a whole sample, so I reduced it. Fitting the curve using more of the points of the peak helps tighten the estimate somewhat, but I'm not sure if that's statistically valid, and it actually makes the estimate worse for the lower-noise situation.

With noise = 0.2 and 3-point fit, it gives values like 0.398 and 0.402 for offset = 0.4.

With noise = 2.0 and 13-point fit, it gives values like 0.156 and 0.595 for offset = 0.4.

$\endgroup$
3
  • $\begingroup$ I'm trying to solve this exact problem for image registration. I need sub-pixel accuracy (0.1 would probably be good enough) but most importantly need no bias, so the interpolation methods don't work. Are there any good (and implemented in python?) methods for this? The zero-padding method will work, but it is too expensive to be practical. $\endgroup$
    – keflavich
    Commented Aug 21, 2012 at 22:15
  • $\begingroup$ @kelavich: Have you tested all the interpolation methods and found unacceptable bias? The recommended approach is a combination of some zero-padding followed by a low-error interpolation. I don't know of any other method, but I bet this would provide you with plenty of accuracy. $\endgroup$
    – endolith
    Commented Aug 21, 2012 at 23:03
  • $\begingroup$ Yes, I've found unacceptable bias in linear and 2nd order interpolation. I've tried FFT zero-padding, but the result is dominated by high-frequency ringing... any chance you could add a zero-padding example? $\endgroup$
    – keflavich
    Commented Aug 22, 2012 at 19:40

Your Answer

By clicking “Post Your Answer”, you agree to our terms of service and acknowledge you have read our privacy policy.

Not the answer you're looking for? Browse other questions tagged or ask your own question.