For a certain experiment of which I have data, I want to calculate the autocorrelation of the measurements. For this I used the expression from Wikipedia, which reads

Here, $n$ is the dataset's size, $0 < k < n$, $\sigma$ is the standard deviation and $\mu$ is the mean.
Now, I've read the descriptions on the page, but I don't fully understand all of the terms in there. I understand why we divide by $(n-k$), because the number of datapoints used constantly changes (you have a finite signal, after all). However, I don't see why we divide by the variance. Moreover, I also don't know why we subtract the mean. Doesn't this lead to problems, if for example for n = 50 and k = 49, we want to multiply $(x_1-\mu)(x_{50}-\mu)$, and $x_1 > \mu$ but $x_{50} < \mu$? I don't really see what a negative correlation would entail.
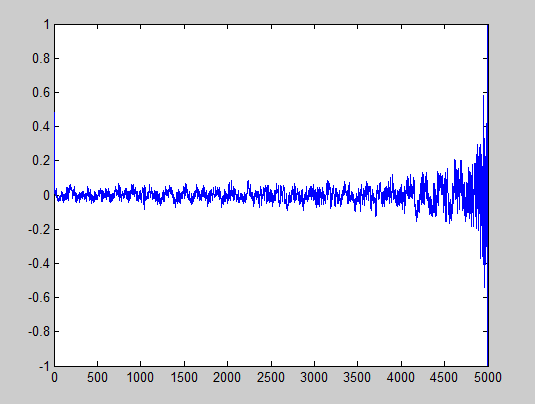
For my data, which is only 0's and 1's, this is even more problematic. Using the above formula the correlations quickly decay to zero, but at the end they violently start to spike, because the contribution from the mean becomes so big, relatively. In my data the mean is 0.5 and the variance is 0.25, so for example, my final point $R(49)$ = $\frac{(0-0.5)(1-0.5)}{0.25}$ = -1
But -1 is huge, especially when 'previously' the correlations had died out to 0. How does one deal with this?
An illustration of this is

