First I would just try to detect peaks and measure the time between them. If there's too much background noise to measure them reliably, I'd try to identify frequencies that are strong in the pulses only and filter out everything else. If that didn't work, I'd try to do a sliding window auto-correlation:
- Identify the longest gap between consecutive pulses
- Using a window that is wide enough to capture the entirety of these two pulses:
- Perform autocorrelation of the windowed signal (padded, not circular)
- Find the peak in the autocorrelation = time delay between pulses
- Convert from time offset to BPM
- Put in output array along with offset of window
- Slide the window to the right (maybe with overlap?)
- Repeat from step 3
Actually, if the sounds you're looking for are similar enough, you can just use a regular cross-correlation, which will act like a sound-specific filter:
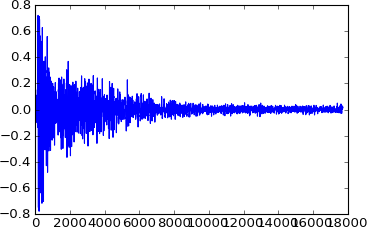
- From the recording, isolate one of the clang sounds, use that as your template.
- Cross-correlate the template with the template with the recording
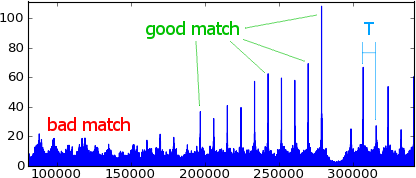
- Every time the clang occurs in the recording, it will produce a large spike in the correlation, while noise or other sounds will not.
- Then it will be easier to find the peaks using a simple threshold and count the period T (samples per beat) between them, which you can then convert to BPM
fs (samples/second) / T (samples/beat) * 60 (seconds/minute) = beats/minute
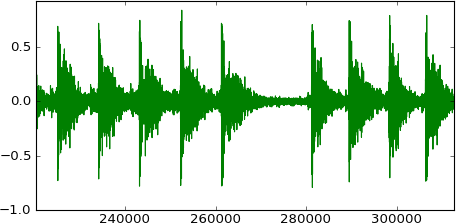
I tried it with your YouTube recording but the clangs are not uniform enough to match perfectly. They match well in the region of time from which I took the template, but not in earlier parts of the file:
Recording:

Template:

Cross-correlation:

from scikits.audiolab import wavread
from scipy.signal import fftconvolve
from matplotlib.pyplot import plot

template, fs, enc = wavread('clang.wav')
recording, fs, enc = wavread('Volvo EC360B NLC clangs.wav')

# Cross-correlation is convolution with one reversed
c = fftconvolve(template[::-1], recording)

plot(abs(c))


