12
$\begingroup$

I am trying to research and figure out how best to attack this problem. It straddles music processing, image processing, and signal processing, and so there are a myriad number of ways to look at it. I wanted to inquire as to the best ways to approach it since what might seem complex in the pure sig-proc domain might be simple (and already solved) by people who do image or music processing. Anyway, the problem is as follows: enter image description here
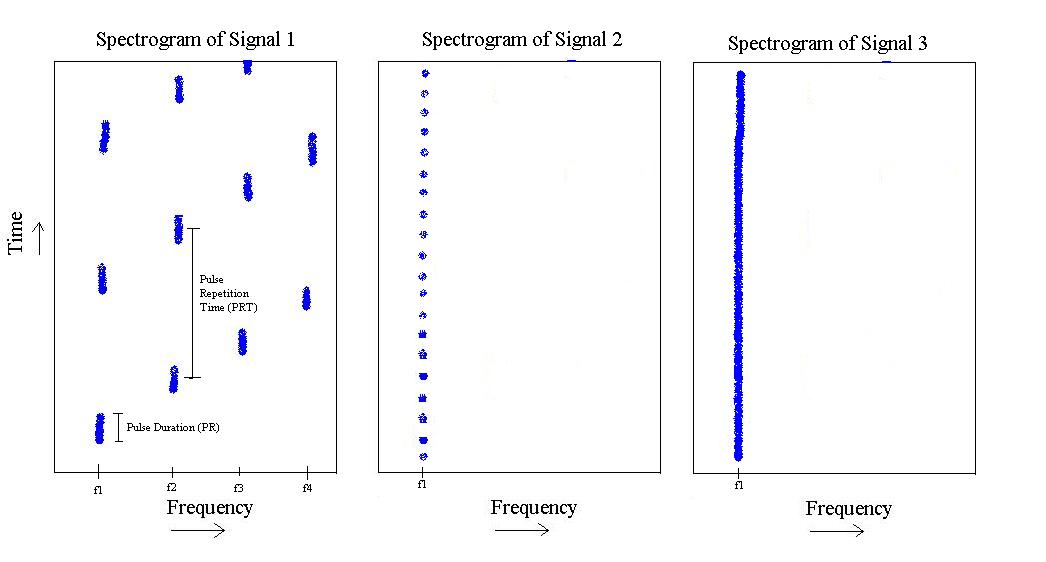
If you forgive my hand drawing of the problem, we can see the following,:

From the above figure, I have 3 different 'types' of signals. The first one is a pulse that sort of 'steps' up in frequency from $f_1$ to $f_4$, and then repeats. It has a specific pulse duration, and a specific pulse-repetition time.

The second one only exists at $f_1$, but has a shorter pulse length and a faster pulse repetition frequency.

Finally the third one is simply a tone at $f_1$.

The problem is, in what way do I approach this problem, such that I can write a classifier that can discriminate between signal-1, signal-2, and signal-3. That is, if you feed it one of the signals, it should be able to tell you this signal is so and so. What best classifier would give me a diagonal confusion matrix?

Some additional context and what I have been thinking of thus far:

As I said this straddles a number of fields. I wanted to inquire as to what methodologies might already exist before I sit down and go to war with this. I dont want to inadvertently re-invent the wheel. Here are some thoughts I have had looking from different view points.

Signal-Processing Standpoint: One thing I have looked at was doing a Cepstral Analysis, and then possibly using the Gabor Bandwidth of the cepstrum in discriminating signal-3 from the other 2, and then measuring the highest peak of the cepstrum in discriminating signal-1 from signal-2. That's my current signal-processing working solution.

Image-Processing Standpoint: Here I am thinking since I CAN in fact create images vis-a-vis the spectrograms, perhaps I can leverage something from that field? I am not intimately familiar with this part, but what about doing a 'line' detect using the Hough Transform, and then somehow 'counting' the lines (what if they are not lines and blobs though?) and going from there? Of course at any point in time when I take a spectrogram all the pulse s you see might be shifted along the time axis, so would this matter? Not sure...

Music-Processing Standpoint: A subset of signal processing to be sure, but it occurs to me that signal-1 has a certain, perhaps repetitive (musical?) quality that people in the music-proc see all the time and have already solved in maybe discriminating instruments? Not sure, but the thought did occur to me. Perhaps this stand point is the best way to look at it, taking a chunk of the time domain and teasing out those step-rates? Again, this is not my field, but I heavily suspect this is something that has been seen before... can we look at all 3 signals as different types of musical instruments?

I should also add that I have a decent amount of training data, so perhaps using some of those methods might just let me do some feature extraction which I can then utilize K-Nearest Neighbor with, but thats just a thought.

Anyway this is where I stand right now, any help is appreciated.

Thanks!

EDITS BASED ON COMMENTS:

  • Yes, $f_1$, $f_2$, $f_3$, $f_4$ are all known in advance. (Some variance but very little. For example, lets say we know that $f_1$ = 400 Khz, but it might come in at 401.32 Khz. However distance to $f_2$ is high, so $f_2$ might be at 500 Khz in comparison.) Signal-1 will ALWAYS step on those 4 known frequencies. Signal-2 will ALWAYS have 1 frequency.

  • Pulse repetition rates and pulse lengths of all three classes of signals are also all known in advance. (Again some variance but very little). Some caveats though, pulse repetition rates and pulse lengths of signals 1 and 2 are always known, but they are a range. Fortunately though, those ranges dont overlap at all.

  • The input is a continuous time series coming in at real time, but we can assume that signals 1, 2, and 3 are mutually exclusive, in that, only one of them exists at any point in time. We also have a lot of flexibility on how much of a time chunk you take it to process at any point in time.

  • The data can be noisy yes, and there might be spurious tones, etc, at bands not in our known $f_1$, $f_2$, $f_3$, $f_4$. This is quite possible. We can assume a med-high SNR just to 'get started' on the problem though.

$\endgroup$
5
  • $\begingroup$ What will be your input? 1/ A continuous stream in which you want to segregate occurrences of signal 1 / 2 / 3 (segmentation + classification problem) or 2/ individual samples with only one type of signal you need to classify into categories 1/2/3? You describe several characteristics of the signals: PRT of signal 1 ; repetition frequency of signal 2 ; frequency of signal 3 ; values of f1/f2/f3/f4. Are these parameters known in advance or variable? Finally, in case your input has several occurrences of those signals to segment, what is the typical duration of a segment? $\endgroup$ Commented Feb 16, 2012 at 19:12
  • $\begingroup$ Another question: from your drawings it looks like you are dealing with pure tones (no harmonics, and no noise). Is that the case, or is the data much dirtier than your drawings? $\endgroup$ Commented Feb 16, 2012 at 19:14
  • $\begingroup$ @pichenettes Thanks, I added the info you need in an edit. $\endgroup$
    – Spacey
    Commented Feb 16, 2012 at 19:35
  • $\begingroup$ A follow up on your progress on and solutions to this question would be appreciated. The analysis depends mostly on the time variability of the sounds studied. if they are faster than an fft window, say under 256 samples you will need high res spectrograms. The more precise the spectrogram, the more you can see small detail information in your sounds. FFT is probably fine, After that the question is simply a case of adding logic operators to classify the sounds using simple pattern analysis routines. analyse duration of pulses, distance between them, chordal nature of the whole, so on. $\endgroup$ Commented May 26, 2015 at 4:20
  • $\begingroup$ it is simple to find the main harmonic just by checking the peak value of every x line, and then you just end up with a graph to analyse using pattern signature analysis programming, which progresses the same as if you were analysing them in rhetoric, just draw rules of the best differentiators you conciously use when comparing and classifying number progressions. $\endgroup$ Commented May 26, 2015 at 4:24

2 Answers 2

7
$\begingroup$

Step 1

Compute the STFT $S(m, k)$ of the signal using a frame size smaller than the pulse duration. I assume that this frame size will still offer sufficient frequency discrimination between f1, f2, f3 and f4. $m$ is the frame index, $k$ is the FFT bin index.

Step 2

For each STFT frame, compute the dominant fundamental frequency using something like YIN, along with a "pitch confidence" indicator, such as the depth of the DMF "dip" computed by YIN.

Let us call $f(m)$ the dominant f0 estimated at frame $m$ and $v(m)$ the pitch confidence detected at frame $m$.

Note that if your data is not that noisy, you can get away by using the autocorrelation as a pitch estimator, and the ratio of the larger secondary peak of the autocorrelation to $r_0$ as a pitch confidence indicator. YIN is cheap to implement, though.

You can also compute the total signal energy $e(m)$ of FFT frame $m$.

Step 3

Consider a sliding window of $M$ STFT frames. $M$ is chosen to be larger than the pulse repetition time and 5 to 10 times smaller than the typical length of a signal segment (for example if an occurrence of a signal lasts for about 10s, and your STFT frame size is 20ms, you can chose $M = 50$).

Extract the following features:

  • $\sigma_f(k)$ is the standard deviation of the sequence $(f(m))_{m \in [k - M, k + M], v(m) > \tau}$
  • $\sigma_v(k)$ is the standard deviation of the sequence $(v(m))_{m \in [k - M, k + M]}$
  • $\sigma_e(k)$ is the standard deviation of the sequence $(e(m))_{m \in [k - M, k + M]}$

Intuitively, $\sigma_f$ measure the frequency stability of the main pitched component of the signal, $\sigma_v$ measure the variability of "pitchiness" of the signal, and $\sigma_e$ the variability of the amplitude of the signal.

This will be the features to base your detection upon. Signals of type 1 will have a high $\sigma_f$ (variable pitch) and a moderate $\sigma_v$ and $\sigma_e$ (steady pitched signal strength). Signals of type 2 will have a low $\sigma_f$ (steady pitch) and a high $\sigma_v$ and $\sigma_e$ (variable strength). Signals of type 3 will have a low $\sigma_f$ (steady pitch) and a low $\sigma_v$ and $\sigma_e$ (steady strength).

Compute these 3 features on your training data and train a naive bayesian classifier (just a bunch of gaussian distributions). Depending on how good your data is you could even get away with classifiers and use hand-defined thresholds on the features, though I don't recommend this.

Step 4

To process an incoming stream of data, compute the STFT, compute the features, and classify each window of $M$ STFT frames.

If your data and classifier are good, you will see something like this:

1, 1, 1, 1, 1, 1, 1, 1, 1, 2, 2, 2, 2, 2, 1, 1, 1, 1, 1, 1, 1, 3, 3, 3, 3, 3, 3, 3

This delimits quite well the start and end time, and type of each signal.

If your data is noisy, there must be spurious misclassified frames:

1, 1, 1, 1, 1, 2, 1, 1, 1, 2, 2, 3, 2, 2, 1, 1, 1, 3, 1, 1, 1, 3, 3, 3, 2, 3, 3, 3

If you see a lot of crap like in the second case, use a mode filter on the data over neighborhoods of 3 or 5 detections ; or use HMMs.

Take home message

What you want to base your detection upon is not a spectral feature, but aggregated temporal statistics of spectral features over windows which are at the same scale as your signal durations. This problem really calls for a processing on two time scales: the STFT frame on which you compute very local signal properties (amplitude, dominant pitch, pitch strength), and larger windows over which you peek at the temporal variability of those signal properties.

$\endgroup$
9
  • $\begingroup$ Note that you could also do it speech recognition style if you want to leverage HTK or the like... Acoustic model: 4 phones P1, P2, P3, P4 (tone at f1, tone at f2, tone at f3, tone at f4) + 1 symbol S for silence. 1 or 2 gaussians per phone. Word model W1 for signal 1: (P1 S P2 S P3 S P4 S)+. Word model W2 for signal 2: (P1 S)+. Word model W3 for signal 3: (P1)+. Sentence model : (W1|W2|W3)*. The only caveat is that if you use a speech recognition toolbox, you'll have to tweak its feature extraction front-end since MFCCs are too low-resolution and pitch-agnostic to tell apart f1/f2/f3/f4. $\endgroup$ Commented Feb 16, 2012 at 20:56
  • $\begingroup$ @pichenettes Thank you pichenettes, that is a very good answer - I have a couple follow ups though: 1) What is 'YIN' that you mention, and what is 'DMF'? I could not find anything on them through google. 2) What exactly is 'pitch confidence' as a measure? 3) You mention that you can use the auto-correlation to find pitch-confidence - autocorrelation of what, the time domain frame or the frame's STFT? (I dont understand this probably because I dont know what you mean pitch confidence). (contd...) $\endgroup$
    – Spacey
    Commented Feb 17, 2012 at 15:58
  • $\begingroup$ @pichenettes (contd) 4) Regarding the features those exist PER WINDOW only yes? So you are computing three stds per window, of, (in this case) 101 frames? In this case when it comes time to train, my 3-D 'point' was made from 3 stds over 101 FRAMES, correct? 5) In your step 4, when you have the number 1,1,1,2,2 etc, each number corresponds to how you classified THAT window correct? The first '1' was classification of window made up of frames -50 to 50, and the second '1' from a window made up of frames -49 to 51, correct? (Window is sliding by 1 frame everytime)... $\endgroup$
    – Spacey
    Commented Feb 17, 2012 at 16:10
  • $\begingroup$ @pichenettes 6) Finally, I should have mentioned that this is to be used as an 'alarm', so that if either signal-1 or signal-2 are present, I get an alarm to ring, but then nothing should go off if there is nothing there - Shouldnt there be some threshold to match before it even starts to try and classify so that you do not get false positives over nothing? (just background noise for example). (I am just learning about the Naive Bayes Classifier now, so dont know if its multi-class). 7) THANKS A LOT BY THE WAY AND THANKS IN ADVANCE! A THOUSAND AND ONE UPVOTES FOR YOU! :-) $\endgroup$
    – Spacey
    Commented Feb 17, 2012 at 16:18
  • 1
    $\begingroup$ 1/ YIN is a classic pitch detection algorithm for speech and music signals. recherche.ircam.fr/equipes/pcm/cheveign/pss/2002_JASA_YIN.pdf . DMF is the "difference magnitude function", the quantity computed by algorithms like YIN for pitch estimation. 2/ A pitch detection algorithm like YIN will yield the estimate of the fundamental frequency, and a "confidence score" indicating how likely it is that the returned pitch is the correct answer. On noisy signals or signals exhibiting several pitches, this will be low, on a pure sine wave this will be very high. $\endgroup$ Commented Feb 17, 2012 at 16:48
3
$\begingroup$

An alternative approach could be four heterodyne detectors: Multiply the input signal with a local oscillators of 4 frequencies and low pass filter the resulting outputs. Each output represents a vertical line in your picture. You get the output at each of the 4 frequencies as a function of time. With the low pass filter you can dial in how much frequency deviation you want to allow for and also how fast you want the outputs to change, i.e. how sharp the edges are.

This will work well even if the signal is fairly noisy.

$\endgroup$
1
  • $\begingroup$ I was thinking about this method - do you forsee any advantages of this method (mixing down and LPF'ing) over working directly at the pass-pand using spectrogram, etc? $\endgroup$
    – Spacey
    Commented Apr 24, 2012 at 15:27

Your Answer

By clicking “Post Your Answer”, you agree to our terms of service and acknowledge you have read our privacy policy.

Not the answer you're looking for? Browse other questions tagged or ask your own question.