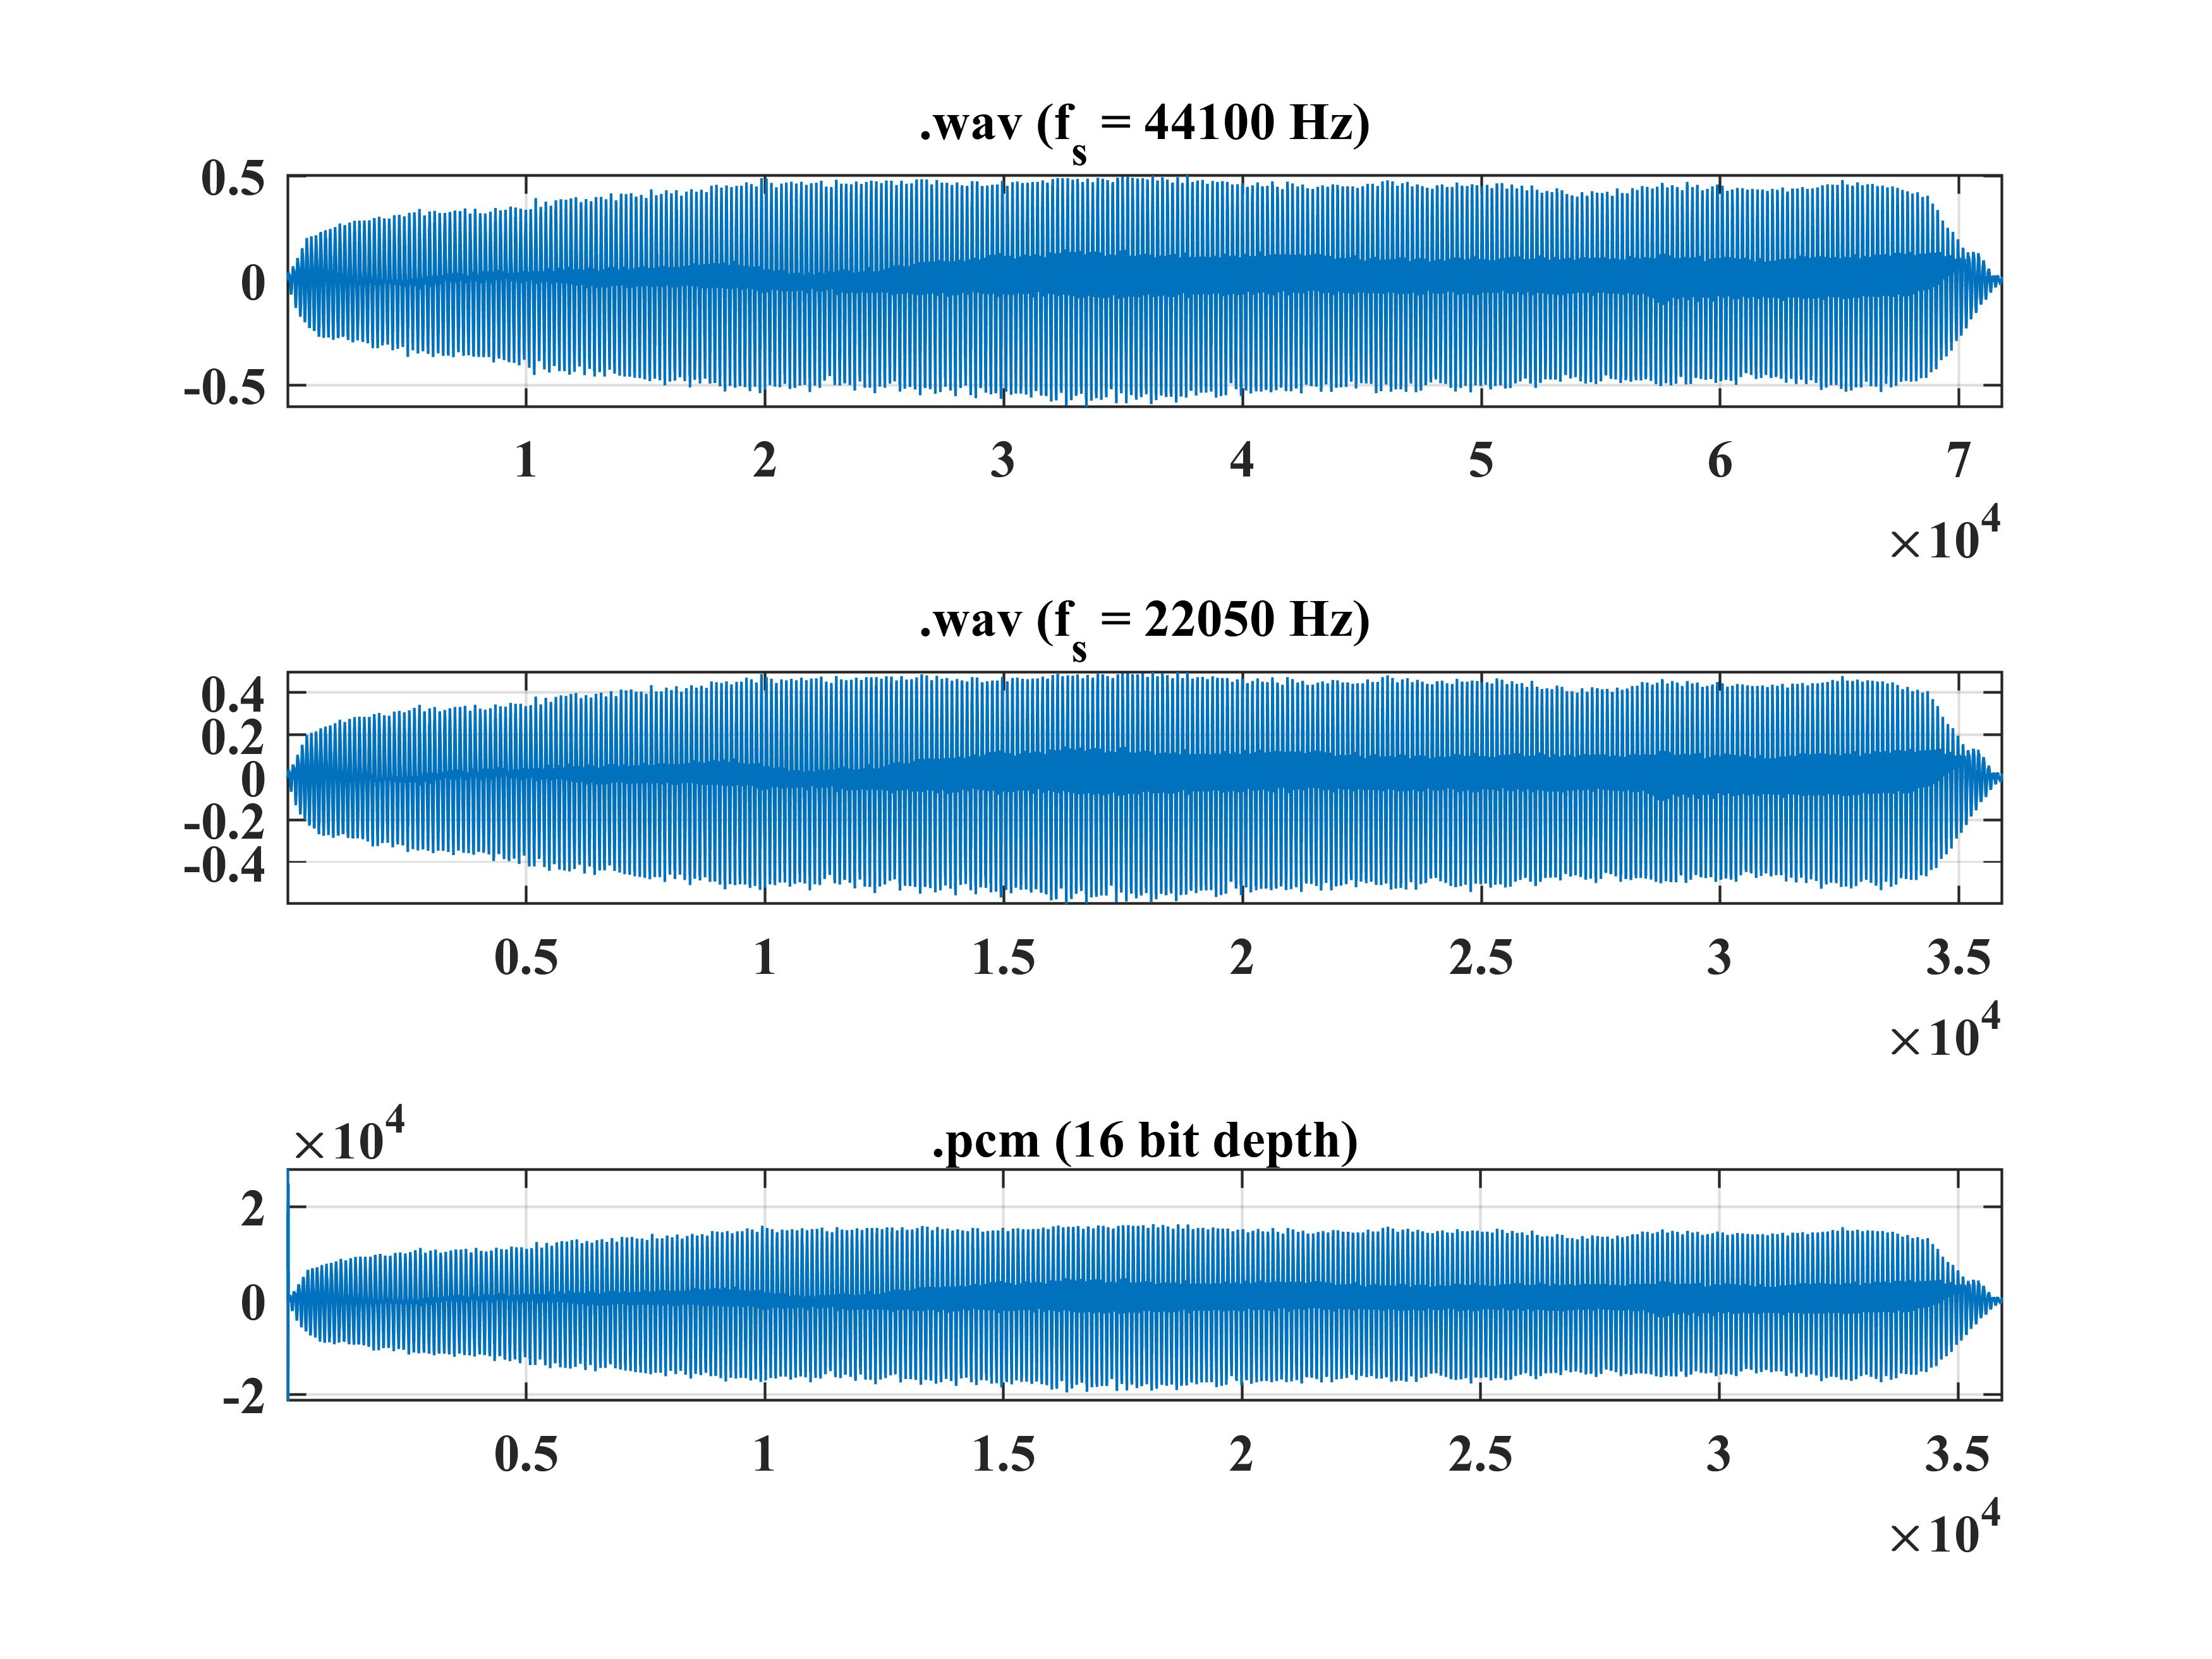
I want to convert a .wav file with a sampling frequency of 44100 Hz to a 16 depth .pcm.
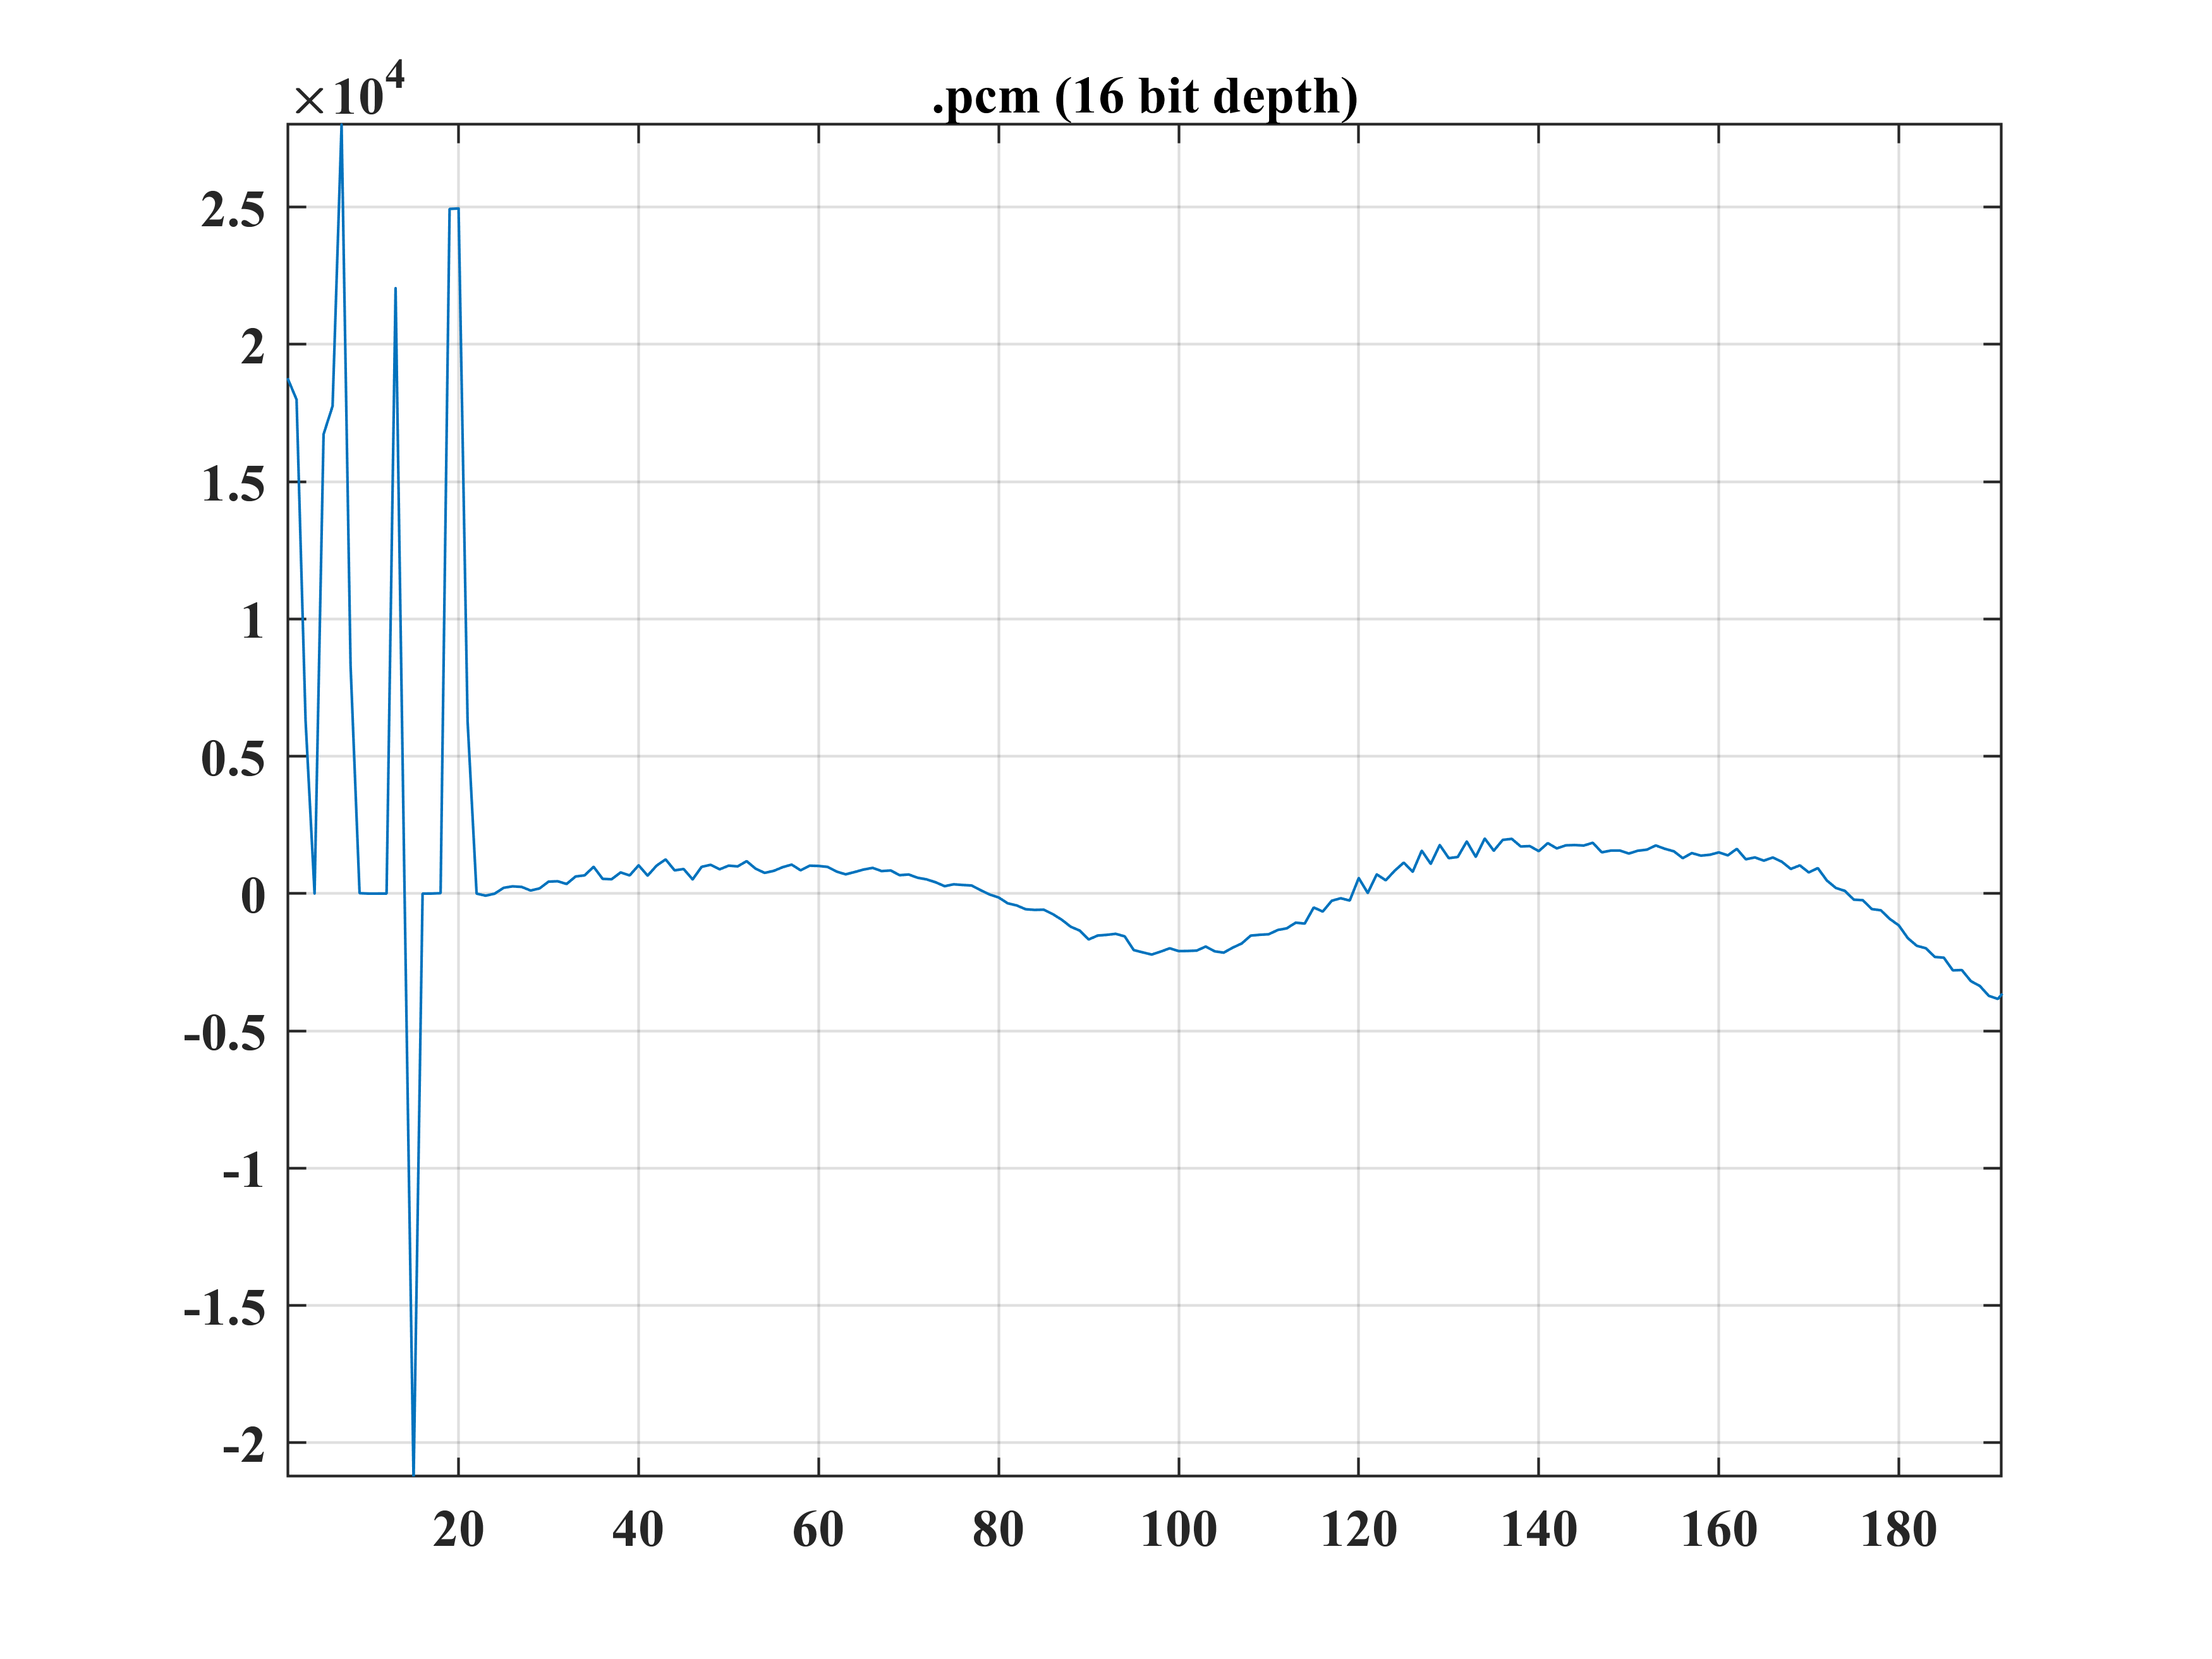
I don't why I'm getting those peaks at the beginning of .pcm plot (second figure below 2). If you could explain and tell me how I can correct it, I would very much appreciate it.
This is my attempt:
% determine the least common multiple (lcm) of fsin and fsout
fsin  = fs;
fsout = 22050;
m     = lcm(fsin, fsout);
% determine the up and down sampling rates
up   = m/fsin;
down = m/fsout;
% resample the input using the computed up/down rates
x_22 = resample(x, up, down);
audiowrite([a_filename(1:11),'_22050','.wav'], x_22, fsout);
precision = 'int16';
fidr      = fopen([a_filename(1:11), '_22050','.wav'], 'r');  % open .wav file to read
fidw      = fopen([a_filename(1:11), '_22050','.pcm'], 'wb'); % open .pcm file to write
w         = int16(fread(fidr, inf, precision));% read wav file
fwrite(fidw, w, precision);
fclose(fidr);
fclose(fidw);

fidr2     = fopen([a_filename(1:11),'_22050','.pcm'], 'r');
[data, ~] = fread(fidr2, 'short');
fclose(fidr2);

% plot
figure(1)
set(1, 'color', 'w')
subplot(311),plot(x)
grid on, box on, axis tight, title('.wav (f_s = 44100 Hz)')
subplot(312),plot(x_22)
grid on, box on, axis tight, title('.wav (f_s = 22050 Hz)')
subplot(313), plot(data)
grid on, box on,  axis tight, title('.pcm (16 bit depth)')
These are the resuts: Here are all the steps of the conversion:
This is the zoom in on the thrid subplot to see the peaks:


