3
$\begingroup$

If you have a vector that is a superposition of an unknown number of identical Gaussian shaped peaks/impulses of unknown width (but all the same width) and different amplitudes (with Poisson or Gaussian noise), would anyone know of a method to infer this width?

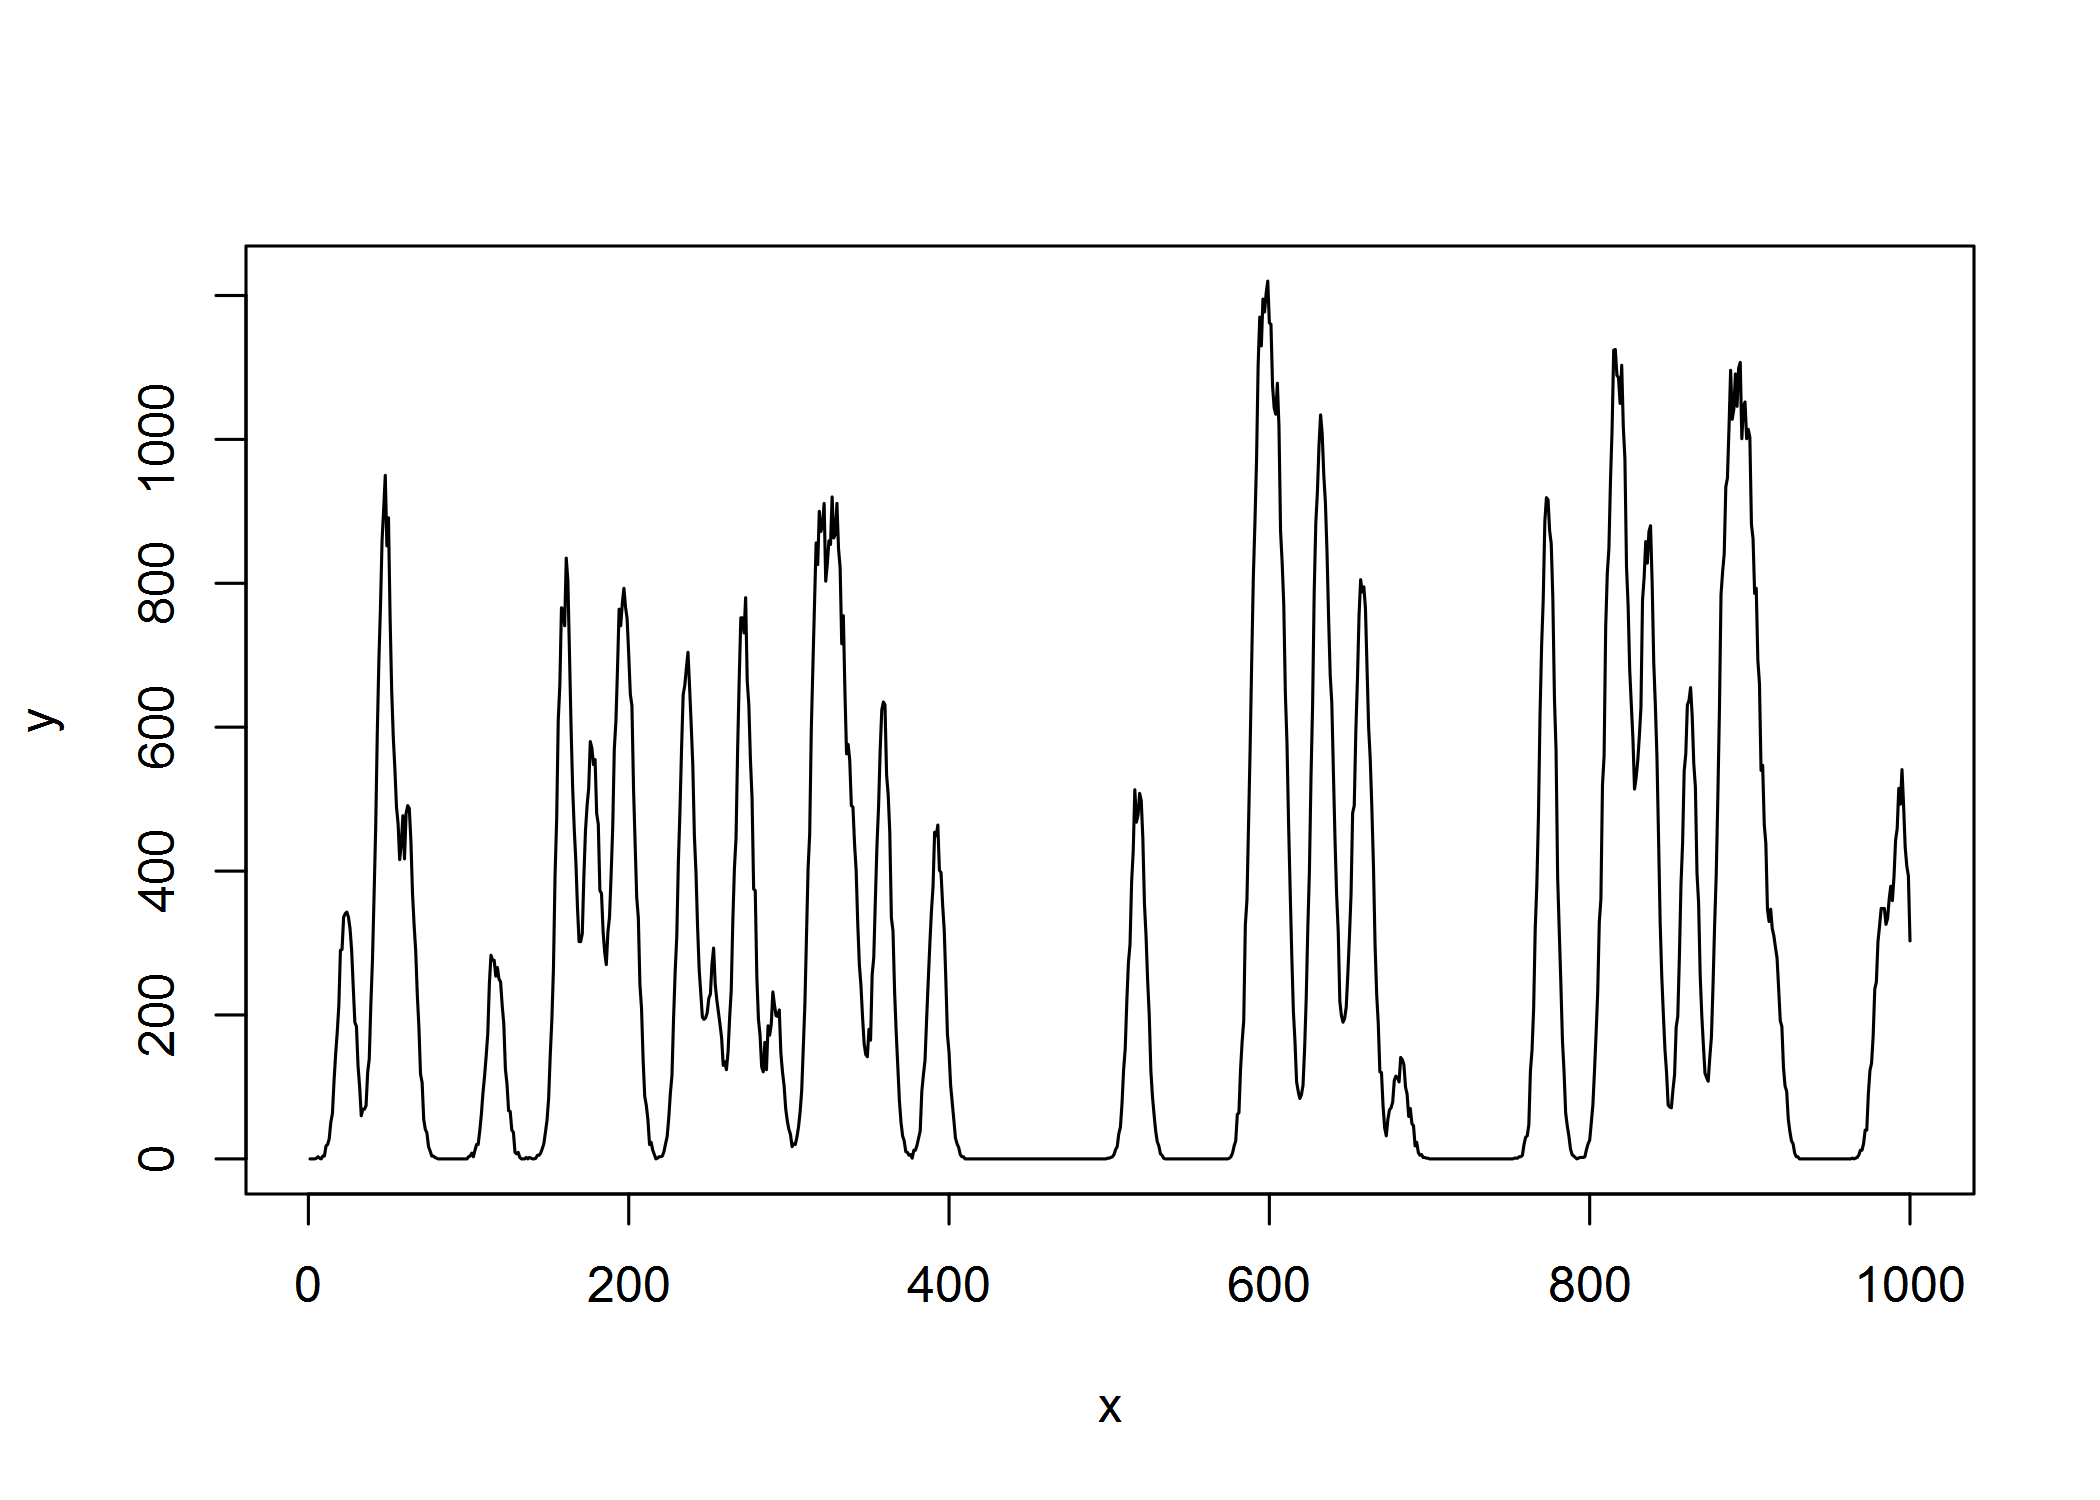
E.g. let's simulate a superposition of Gaussian peaks of width 5 in R:

gauspeak=function(x, u, w, h=1) h*exp(((x-u)^2)/(-2*(w^2)))

sumgauspeaks = function(x, u, w, h) {
  npeaks = length(u)
  n = length(x)
  Y_nonoise = do.call(cbind, lapply(1:npeaks, function (peak) gauspeak(x, u=u[peak], w=w[peak], h=h[peak]) ))
  y_nonoise = rowSums(Y_nonoise)
  set.seed(101)
  Y = apply(Y_nonoise, 2, function(col) rpois(n,col)) # peaks with Poisson noise
  y = rowSums(Y) # measured noisy signal (superposition of identical Gaussians of unknown width & width different heights)
  return(y)
}

x = 1:1000
npeaks = 40 # unknown number of peaks
u = runif(npeaks, min=min(x), max=max(x)) # unknown peak locations
w = rep(5,npeaks) # unknown peak widths (all the same though)
h = runif(npeaks, min=0, max=1000) # unknown peak heights
y = sumgauspeaks(x, u, w, h)
plot(x,y,type="l")

enter image description here

If I measure this (nonnegative) signal in this graph I would then like to be able to estimate that the (constant) peak width w of the superimposed Gaussian peaks in this case was 5 (without knowing a priori their amplitudes/heights or the true number of peaks or their position, but assuming all are identically shaped but differently scaled Gaussians)... Anybody any thoughts how to do this in the most efficient way? Would this be possible e.g. from the DFT or something? Or by estimating a sparse spike train based on a covariate matrix/dictionary with temporally shifted Gaussian peaks of different widths and checking which class of peak width is selected most frequently based on say orthogonal matching pursuit or a LASSO regression? Any thoughts? I just need a rough estimate, it doesn't need to be accurate, but I would like it to be fast...

EDIT: One algorithm that I know of, but which does more than what I want in that it estimates a single best peak shape explaining the signal is that of de Rooi & Eilers (2011) which is implemented in this R code:

# 1. GAUSSIAN PEAK FUNCTION ####
gauspeak=function(x, u, w, h=1) h*exp(((x-u)^2)/(-2*(w^2)))

# 2. FUNCTION TO SIMULATE SUM OF GAUSSIAN PEAKS WITH POISSON NOISE ####
sumgauspeaks = function(x, u, w, h) {
  npeaks = length(u)
  n = length(x)
  Y_nonoise = do.call(cbind, lapply(1:npeaks, function (peak) gauspeak(x, u=u[peak], w=w[peak], h=h[peak]) ))
  y_nonoise = rowSums(Y_nonoise)
  set.seed(101)
  Y = apply(Y_nonoise, 2, function(col) rpois(n,col)) # peaks with Poisson noise
  y = rowSums(Y) # measured noisy signal (superposition of identical Gaussians of unknown width & width different heights)
  return(y)
}

# 3. FUNCTION TO CALCULATE FULL WIDTH AT HALF MAXIMUM OF A FITTED SIGNAL ####
# plus corresponding width of a Gaussian peak function if signal were Gaussian
fwhm = function(x, y, interpol=FALSE) { 
  halfheight = max(y)/2
  id.maxy = which.max(y)
  y1 = y[1:id.maxy]
  y2 = y[id.maxy:length(y)]
  x1 = x[1:id.maxy]
  x2 = x[id.maxy:length(y)]
  if (interpol) {
    x.start = approx(x=y1,y=x1, xout=halfheight, method="linear")$y # use spline() if you would like spline interpolation
x.stop = approx(x=y2,y=x2, xout=halfheight, method="linear")$y # use spline() if you would like spline interpolation
  } else { 
    x.start = x[which.min(abs(y1-halfheight))]
    x.stop = x[which.min(abs(y2-halfheight))+id.maxy]
  }
  fwhm = x.stop-x.start
  width = fwhm/(2*sqrt(2*log(2)))
  return(list(fwhm=fwhm, width=width))
}

# 4. FUNCTION TO CARRY OUT FAST GAUSSIAN PEAK FIT (USING TER BRAAK / OKSANEN PARAMETERISATION) #### 
# i.e. fit  a quadratic model on a log scale using a least square model fit on a log transformed Y scale (if control$fast==TRUE) or using a generalized linear model with Poisson noise fit on a log link scale (if control$fast==FALSE)
# see https://esajournals.onlinelibrary.wiley.com/doi/abs/10.1890/0012-9658(2001)082%5B1191:CIFTOI%5D2.0.CO%3B2
gausfit = function(x, y, control=list(start=NULL, fast=TRUE)) {
  maxy <- max(y)
  if (maxy==0) { return(list(x=x, y=y, fitted=rep(0,length(y)))) }
  if (maxy<=1) { ymax <- 1E5 } else { ymax <- maxy }
  yscaling <- ymax/maxy
  y <- pmax(round(y*yscaling),0)
  ymax_idx <- which.max(y)
  subs_start <- suppressWarnings(max(which(y[1:ymax_idx]==0)))
  if (is.infinite(subs_start)) subs_start <- 1
  subs_stop <- (ymax_idx+suppressWarnings(min(which(y[ymax_idx:length(y)]==0))))
  if (is.infinite(subs_stop)) subs_stop <- length(y)
  subset <- subs_start:subs_stop # y!=0 #  # remove zeros on the side
  x_subs <- x[subset]
  y_subs <- y[subset]
  # we initialize coefficients with weighted least squares model fit on log transformed Y scale
  if (is.null(control$start)) { offs <- 1E-10
                            weights <- y_subs^2/(y_subs+offs)^2 
  c <- control$start <- .lm.fit(x=cbind(1,x_subs,x_subs^2)*sqrt(weights), 
                            y=log(y_subs+offs)*sqrt(weights))$coefficients 
  } 

  # now do actual quadratic GLM fit (if fast==FALSE)
  if (control$fast==FALSE) { 
c <- suppressWarnings(glm.fit(cbind(1,x_subs,x_subs^2), y_subs, 
                              family=poisson(link=log), 
                              start=control$start, 
                              control=glm.control(epsilon = 1e-8, maxit = 50, trace = FALSE)
))$coefficients 
  }

  if (c[[3]]<0) {
    u_fitted <- -c[[2]]/2/c[[3]] # inferred mode
    w_fitted <- sqrt(-(1/2)/c[[3]]) # inferred width
    h_fitted <- exp(c[1] - c[2]^2/4/c[3]) # inferred peak height (* yscaling)
    fitted <- gauspeak(x=x, u=u_fitted, w=w_fitted, h=h_fitted/yscaling)
  } else { 
    u_fitted <- mean(x) # inferred mode
    w_fitted <- diff(range(x))/2 # inferred width
    h_fitted <- 0 # inferred peak height (* yscaling)
    fitted <- rep(0,length(x))
  }
  out <- list(x=x, y=y, 
              fitted=fitted,
              fitted.pars=c(u=u_fitted, w=w_fitted, h=h_fitted))
  return(out)
}


# 5. DECONVOLUTION FUNCTIONS OF DE ROOI & EILERS 2011 ARTICLE ####
# see https://www.sciencedirect.com/science/article/pii/S0003267011006696

ALS_baseline_fun <- function(y, d = 2, lambda = 10, w = 1, p=0.01){
  m <- length(y)
  E <- diag(m)
  D <- diff(E, diff = d)
  w <- rep(w, m)
  W <- diag(w)
  for (i in 1:20)
  {
    W <- diag(w)
    z <- solve(W + lambda * t(D) %*% D, w * y)
    w <- p * (y > z) + (1 - p) * (y < z)
  }
  return(z)
}


#############################################################
# y = input
# g = given or initial guess of impulse respons
# baseline: 0 = no baseline correction
#               1 = ALS fitting
#               2 = ALS fitting and solving the big system
# gamma = penalty parameter for ALS baseline
# kappa = penalty parameter for deconvolution of the signal
# lambda = penalty for G matrix
# blind: FALSE = impuls respons is taken as given
#          TRUE = impuls response is iteratively improved
#############################################################

deconvol_fun <- function(y, g, baseline=0, gamma, lambda, kappa, k=1, blind=FALSE)
{
  if(baseline!=0)
  {
    # fit baseline
    z <- ALS_baseline_fun(y, d=2, gamma, w=1, p=0.01)
    y <- y - z
  }

  # estimate peaks
  peaks <- L0_peak_fun(y, g, kappa=kappa, blind=blind, lambda=lambda)

  # 'big system' part
  if(baseline==2)
  {
    stop("this function is not yet implemented")
  }
  list(a=peaks$a, g=peaks$g)
}


# actual deconvolution function

L0_peak_fun <- function(y, g, kappa=0.02, blind=FALSE, lambda=0)
{
  nloop = 20
  p = 1
  nc = length(g)
  n = length(y)
  m = n
  w = rep(1, m)
  Gg = matrix(0, nc, nloop)
  for (loop in 1:nloop) 
  {
    # Pulsvormmatrix C for fitting
    G = matrix(0, n + nc - 1, n)
    for (k in 1:n) G[(1:nc) + k - 1, k] = g
    G = G[floor(nc / 2) + (1:m), ]

    # Deconvolve
    kappa = kappa
    s0 = 0
    beta = 0.001
    w = rep(1, m)
    for (it  in 1:10) 
    {
      W = diag(c(w))
      a = solve(W + t(G) %*% G,  t(G) %*% y)
      w1 = w
      w = kappa / (beta + a^2)
      z = G %*% a
      r = y - z
      s = t(r) %*% r + kappa %*% t(a) %*% a
      ds = s - s0
      if (it == 10) cat(ds, '\n')
      s0 = s
    }

    # Improve C
    if(blind==TRUE)
    {
      G = matrix(0, m + nc - 1, nc)
      for (k in 1:nc) G[(1:n) + k - 1, k] = a
      G = G[(1:m) + floor(nc / 2), ]
      Dg = diff(diag(nc), 1)
      lambda = lambda
      gnew = solve(t(G) %*% G + lambda * t(Dg) %*% Dg, t(G) %*% y)
      g = gnew / max(gnew)
      Gg[, loop] = g
    }

    if (abs(ds) < 1e-6) break
  }
  list(a=a, g=g)
}


# 6. DO TEST ####
x = 1:1000
npeaks = 40
u = runif(npeaks, min=min(x), max=max(x)) # unknown peak locations
w = rep(5,npeaks) # unknown peak widths
h = runif(npeaks, min=0, max=1000) # unknown peak heights
y = sumgauspeaks(x=x, u, w, h)
dev.off()
plot(x,y,type="l")

# estimate peak shape using De Rooi & Eiler's 2011 method
nc=50
g = gauspeak(1:nc, u=25, w=2, h=1) # initial guess of peak shape (peak width guess here too narrow)
system.time(dec <- deconvol_fun(y/max(y), g, baseline=0, 
                                lambda=1E-5, kappa=0.01, blind=TRUE)) # takes 149s

dev.off()
par(mfrow=c(3,1))
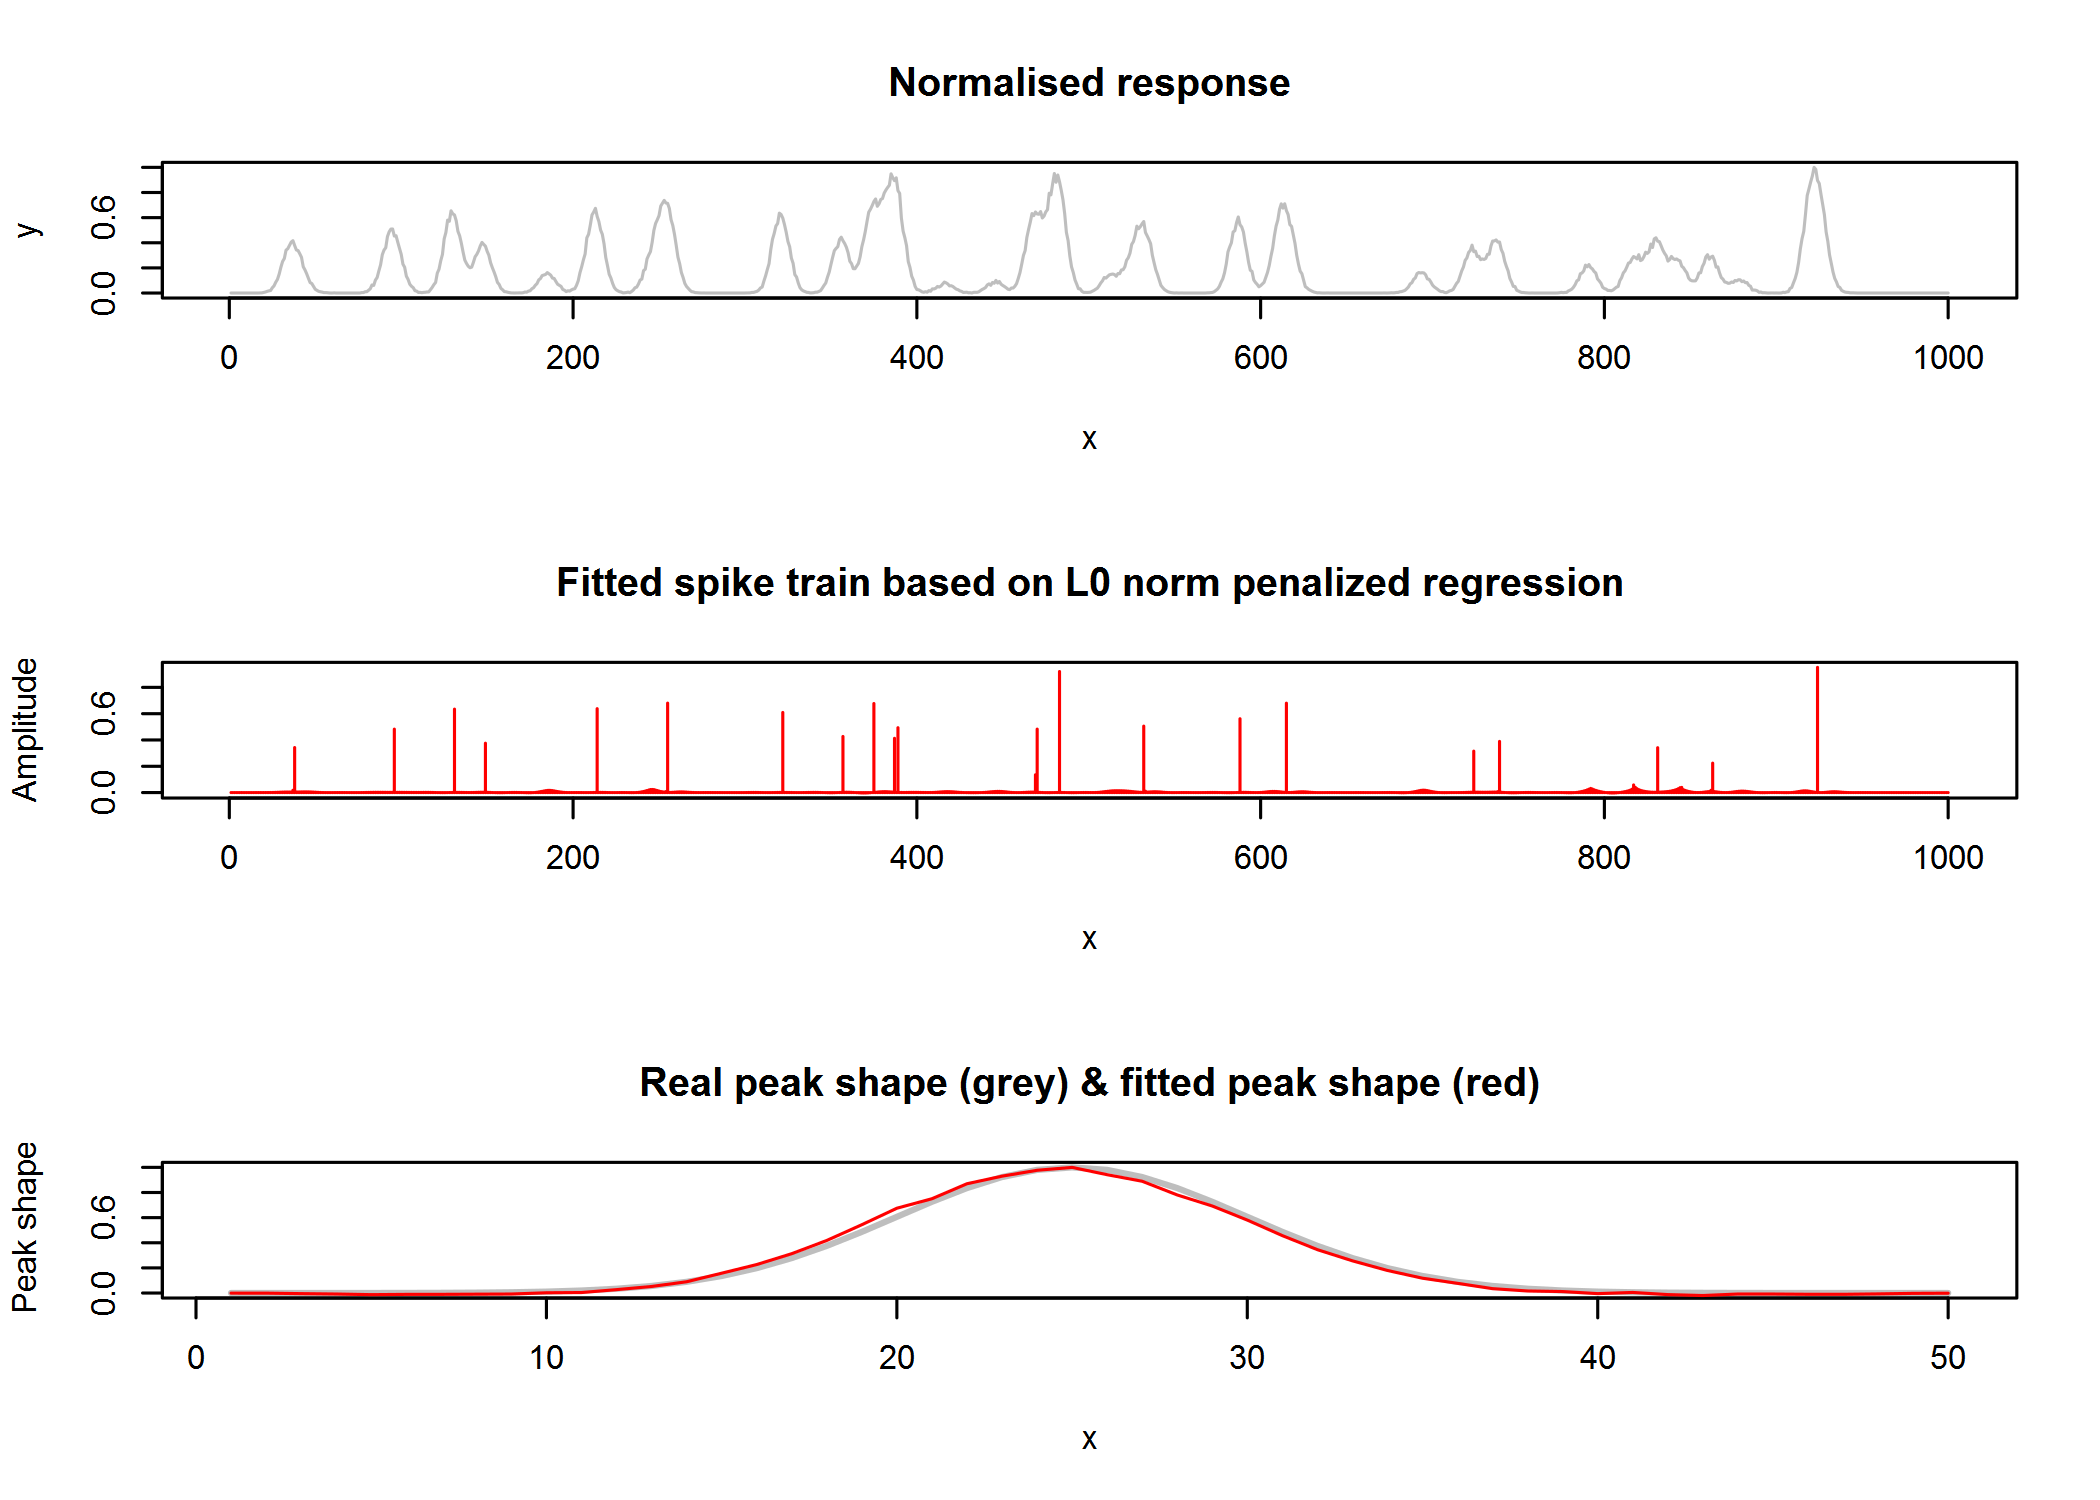
plot(1:length(y), y/max(y),type='l', col="grey", xlab="x", ylab="y", main="Normalised response")
plot(1:length(y), dec$a, type='h', col="red", xlab="x", ylab="Amplitude", main="Fitted spike train based on L0 norm penalized regression")
plot(1:nc, gauspeak(1:50, u=25, w=w[[1]], h=1), type='l', col="grey", lwd=2, xlab="x", ylab="Peak shape", main="Real peak shape (grey) & fitted peak shape (red)")
lines(1:nc, dec$g,type='l', col="red")

enter image description here

fwhm(1:nc, dec$g, interpol=TRUE)$width # estimated width based on full width at half max: 5.10
gausfit(1:nc, y=dec$g, control=list(start=NULL, fast=FALSE))$fitted.pars # estimated width based on Gaussian fit on inferred peak shape: 4.87

For L0 norm penalized regularized / best subset selection I also found this article which I believe is a further development of the Eilers method:

Problems with this algo are that (1) the fitting is not very stable in terms of convergence properties, (2) there are two regularization parameters to tune, (3) that peak shape is not constrained to be Gaussian (could be solved by fitting Gaussian on inferred peak shape after each iteration, but maybe there is a better way??) and (4) the algo is slow (150 s for this small example on my laptop). So ideally I'm looking for something more robust & faster...

$\endgroup$
9
  • 1
    $\begingroup$ It really depends on what you are after, you could do Kernel Density Estimation or even Deconvolution with the known gaussian. Do you think you could share a bit more about the problem? $\endgroup$
    – A_A
    Commented Jan 10, 2019 at 13:57
  • $\begingroup$ Well the problem here would be that the Gaussian is not known, so I would like to estimate the most likely peak shape given that the signal that I measuring is a superposition of many such peaks with different amplitude - I've added some R code to make my question clearer... $\endgroup$ Commented Jan 10, 2019 at 14:12
  • $\begingroup$ It would be OK to assume the peaks were Gaussian though, even though their width and amplitudes are unknown... The peak locations and amplitudes are not important for my purposes - it's just the average width I need... $\endgroup$ Commented Jan 10, 2019 at 14:16
  • $\begingroup$ What about those peaks that are very very close to each other? Do they need to be resolved individually? $\endgroup$
    – A_A
    Commented Jan 10, 2019 at 14:22
  • $\begingroup$ Ideally yes - though the recovery of individual peaks is not that important, it's more that I need a decent estimate of the average peak width over this whole window, taking into account that peaks can of course be superimposed and can overlap. The fact that I assume that all peaks are identically shaped should help with the identifiability of the problem though... $\endgroup$ Commented Jan 10, 2019 at 14:25

4 Answers 4

2
$\begingroup$

My first comment would be why the heck are you using R if you are concerned with processing speed, or are you just prototyping algorithms?

Anyway, Without getting into how I derived it, here is a formula that is much much faster:

Take the log of your signal (-1 if 0):

$$ g[x] = \ln(y[x]) $$

Calculate the following value:

$$ B = \frac{ \begin{array}{c} g[x-6] + g[x-5] + g[x-4] \\ -g[x-3] - g[x-2] - g[x-1] \\ -g[x+1] - g[x+2] - g[x+3] \\ +g[x+4] + g[x+5] + g[x+6] \end{array} }{152} $$

When $ B < 0 $

$$ w[x] = \sqrt{ \frac{-1}{2B} } $$

Otherwise, -1. (Could be due to noise, away from peak )

Here are some results from a test run:

  y     ln(y)   w
------ ------ -----  
   114 4.7362 -1.00
   167 5.1180 -1.00
   233 5.4510 -1.00
   326 5.7869  6.69
   439 6.0845  6.19
   668 6.5043  6.40
   769 6.6451  5.32
  1003 6.9108  4.83
  1213 7.1009  4.97
  1435 7.2689  5.01
  1613 7.3859  4.92
  1645 7.4055  4.81
  1645 7.4055  5.13
  1722 7.4512  5.58
  1550 7.3460  5.00
  1464 7.2889  4.91
  1301 7.1709  5.42
  1072 6.9773  5.10
   852 6.7476  4.98
   705 6.5582  4.94
   526 6.2653  5.25
   378 5.9349  6.50
   269 5.5947  6.37
   156 5.0499  4.42
   136 4.9127  2.03

As you can see it is pretty accurate near the peak. There is a rule for generating formulas like this. It can be expanded to cover as wide a stance as desired. (Yeah, I think this will be a future blog article. Thanks for the puzzle.)

I inserted these lines at the end of your code to get my values:

fileConn<-file("y.txt")
write(y, fileConn)
close(fileConn)

A few notes:

1) The value calculated at the peak is going to be slightly inferior to the values calculated nearby because the peak value itself is not included in the calculation.

2) The formula may still give a value while having -1s as input from the log column. All the g[x+d] values must be valid.

3) The formula is designed for standalone peaks

4) The formula squashes any constant value and any linear trends so it should mitigate the effects of nearby tails

5) You still have to figure out how to best use it if it suits your purposes.

I'll elaborate upon request.


Clearly you would rather then solve the problem without the constraint. I've made some improvements.

You have nine clumps (sections separated by zeros)

c     n     w
--  ---   ---
0     0    79
1   112    95
2   238    36
3   328    44
4   407    34
5   492    38
6   536   189
7   729   132
8   888    76

Initial survey of peaks:

 n  c   Center -B(alt)   Miss    Width of Peak
--- -  ------  ------    ----    ----    
 10 0    9.96  0.0210    0.02    4.87
 33 0   32.38  0.0204    0.03    4.95
 60 0   59.82  0.0152    0.16    5.74

131 1  130.27  0.0196    0.05    5.05
161 1  160.31  0.0163    0.14    5.54
189 1  188.16  0.0203    0.02    4.97

256 2  255.81  0.0202    0.02    4.97

355 3  354.13  0.0210    0.05    4.88

423 4  422.05  0.0203    0.07    4.97

510 5  509.91  0.0209    0.03    4.90

555 6  554.90  0.0203    0.03    4.96
576 6  575.34  0.0200    0.11    5.00
609 6  608.31  0.0127    0.25    6.27
644 6  644.67  0.0099    0.63    7.09
657 6  656.34  0.0134    0.34    6.11
680 6  679.08  0.0194    0.12    5.08
703 6  702.81  0.0101    0.07    7.05

748 7  747.02  0.0171    0.05    5.40
773 7  772.18  0.0202    0.07    4.97
800 7  799.87  0.0140    0.43    5.98
821 7  820.74  0.0119    0.03    6.47
842 7  841.34  0.0196    0.12    5.05

906 8  905.78  0.0226    0.06    4.70
933 8  932.95  0.0113    0.59    6.66
947 8  945.79  0.0156    0.28    5.67

The "Miss" column is a metric for how close the data fits a Gaussian at that point. You can see that the isolated peaks give you quite good results. I am confident from my work in teasing apart tones in a DFT that I can tease apart the Gaussians in the clumps so the readings are as good as the standalone ones.

I doubt you can compete with mine in speed. This run on a fairly old computer took .02 seconds in Python, including the time to print to the console.

$\endgroup$
5
  • $\begingroup$ Well it's just that this is part of a big project which makes it easier to use R than having to code everything in plain C++... Some reason for using it than all those engineers using Matlab I guess... I'm mostly using functions that rely on compiled C code though and linear algebra, and both of those are fast, and other algos that need speeding up I code in Rcpp... Problem with your algo I fear is that it only works for standalone peaks, and I am never sure that a peak is really standalone... So I may stick with my nnls solution for now... But thanks for posting this approach so +1! $\endgroup$ Commented Jan 12, 2019 at 10:03
  • $\begingroup$ @TomWenseleers,You're welcome. You seemed to be looking for a speedy rough solution. I hope you noticed that I didn't rely on your consistent width constraint. Is the constraint inherent in your problem or is it something you've accepted thinking it necessary for a solution? It seems to me that if the width is consistent across all peaks, and you are satisfied with a rough solution, that the readings from the most isolated peaked could be used as a proxy for all and the clumped peaks ignored. $\endgroup$ Commented Jan 12, 2019 at 16:04
  • $\begingroup$ I am working with GC/MS chromatograms, and the original data is in fact multichannel. I was planning to apply this method to one of the first nonnegative double SVDs. My peaks tend to become wider later on in the chromatogram, and sometimes larger peaks can also be a bit wider. Sometimes they may also not be 100% Gaussian. For my method I was thinking of applying it to say 10 or 20 windows spread out over the chromatogram to have an idea of how peak width varies along the chomatogram. This peak width will then be used to choose an appropriate loess span to denoise the double nonnegative SVDs.. $\endgroup$ Commented Jan 12, 2019 at 18:38
  • $\begingroup$ ..before I apply my later downstream analysis (sequential peak picking resulting in a sparse nonnegative matrix decomposition with appropriate peak shape constraints). It is in this later phase that I will fit the correct detailed (log-concave) shape of all the peaks, so this first guess doesn't need to be that accurate... I'll test the performance of my method against yours. In terms of speed it seems that both would be fast enough. The original data matrix is 20 000 x 500 channels. $\endgroup$ Commented Jan 12, 2019 at 18:40
  • $\begingroup$ @CedronDawg, Any chance you share how you derived the formula? $\endgroup$
    – Royi
    Commented Aug 20, 2019 at 5:10
2
$\begingroup$

Ha just figured out a faster and better method just using BIC-optimized selection of optimal peak width, using a banded covariate matrix with shifted Gaussian peak shapes of given width & using nonnegative least squares fits (which is solved using an active set method and regularizes the problem a bit, though less of course than with LASSO or L0 norm penalization like above but with the upshot you don't have to tune any regularization parameters).

The R code is below and it's >10x faster than what I had and more reliable (13s for a window of 1000, 2.5s for a window of 500, 0.04s for a window of 200):

# FUNCTION TO CALCULATE INFORMATION CRITERIA AIC & BIC GIVING GOODNESS OF FIT ####
# SSs are calculated on given transformed scale (e.g. sqrt() variance stabilizing function for Poisson data)
IC = function (y, yhat, npars, transf = function (y) sqrt(y)) { 
  nobs = length(y)
  RSS = sum((transf(y)-transf(yhat))^2) # residual SS on sqrt() scale
  min2LL = nobs + nobs*log(2*pi) + nobs*log(RSS/nobs) # -2*logL
  AIC = min2LL + 2*npars 
  BIC = min2LL + log(nobs)*npars
  return(list(AIC=AIC, BIC=BIC))
}

# FUNCTION GIVING FIT QUALITY (BIC) IN FUNCTION OF GAUSSIAN PEAK WIDTH USED IN BANDED COVARIATE MATRIX OF NNLS FIT
fitqual = function(width) {
  bandedM = do.call(cbind, lapply(1:length(y), function (u) gauspeak(1:length(y), u=u, w=width, h=1)))
  require(nnls)
  fit = nnls(A=bandedM, b=y)
  fitqual = IC(y, fit$fitted, npars=sum(fit$x>0), transf =  function(y) sqrt(y))$BIC # fit$deviance=RSS
  return(fitqual) 
} 
system.time(what <- optimize(fitqual, interval=c(3, 6), maximum=FALSE, tol=1E-3)$minimum) # 13 s
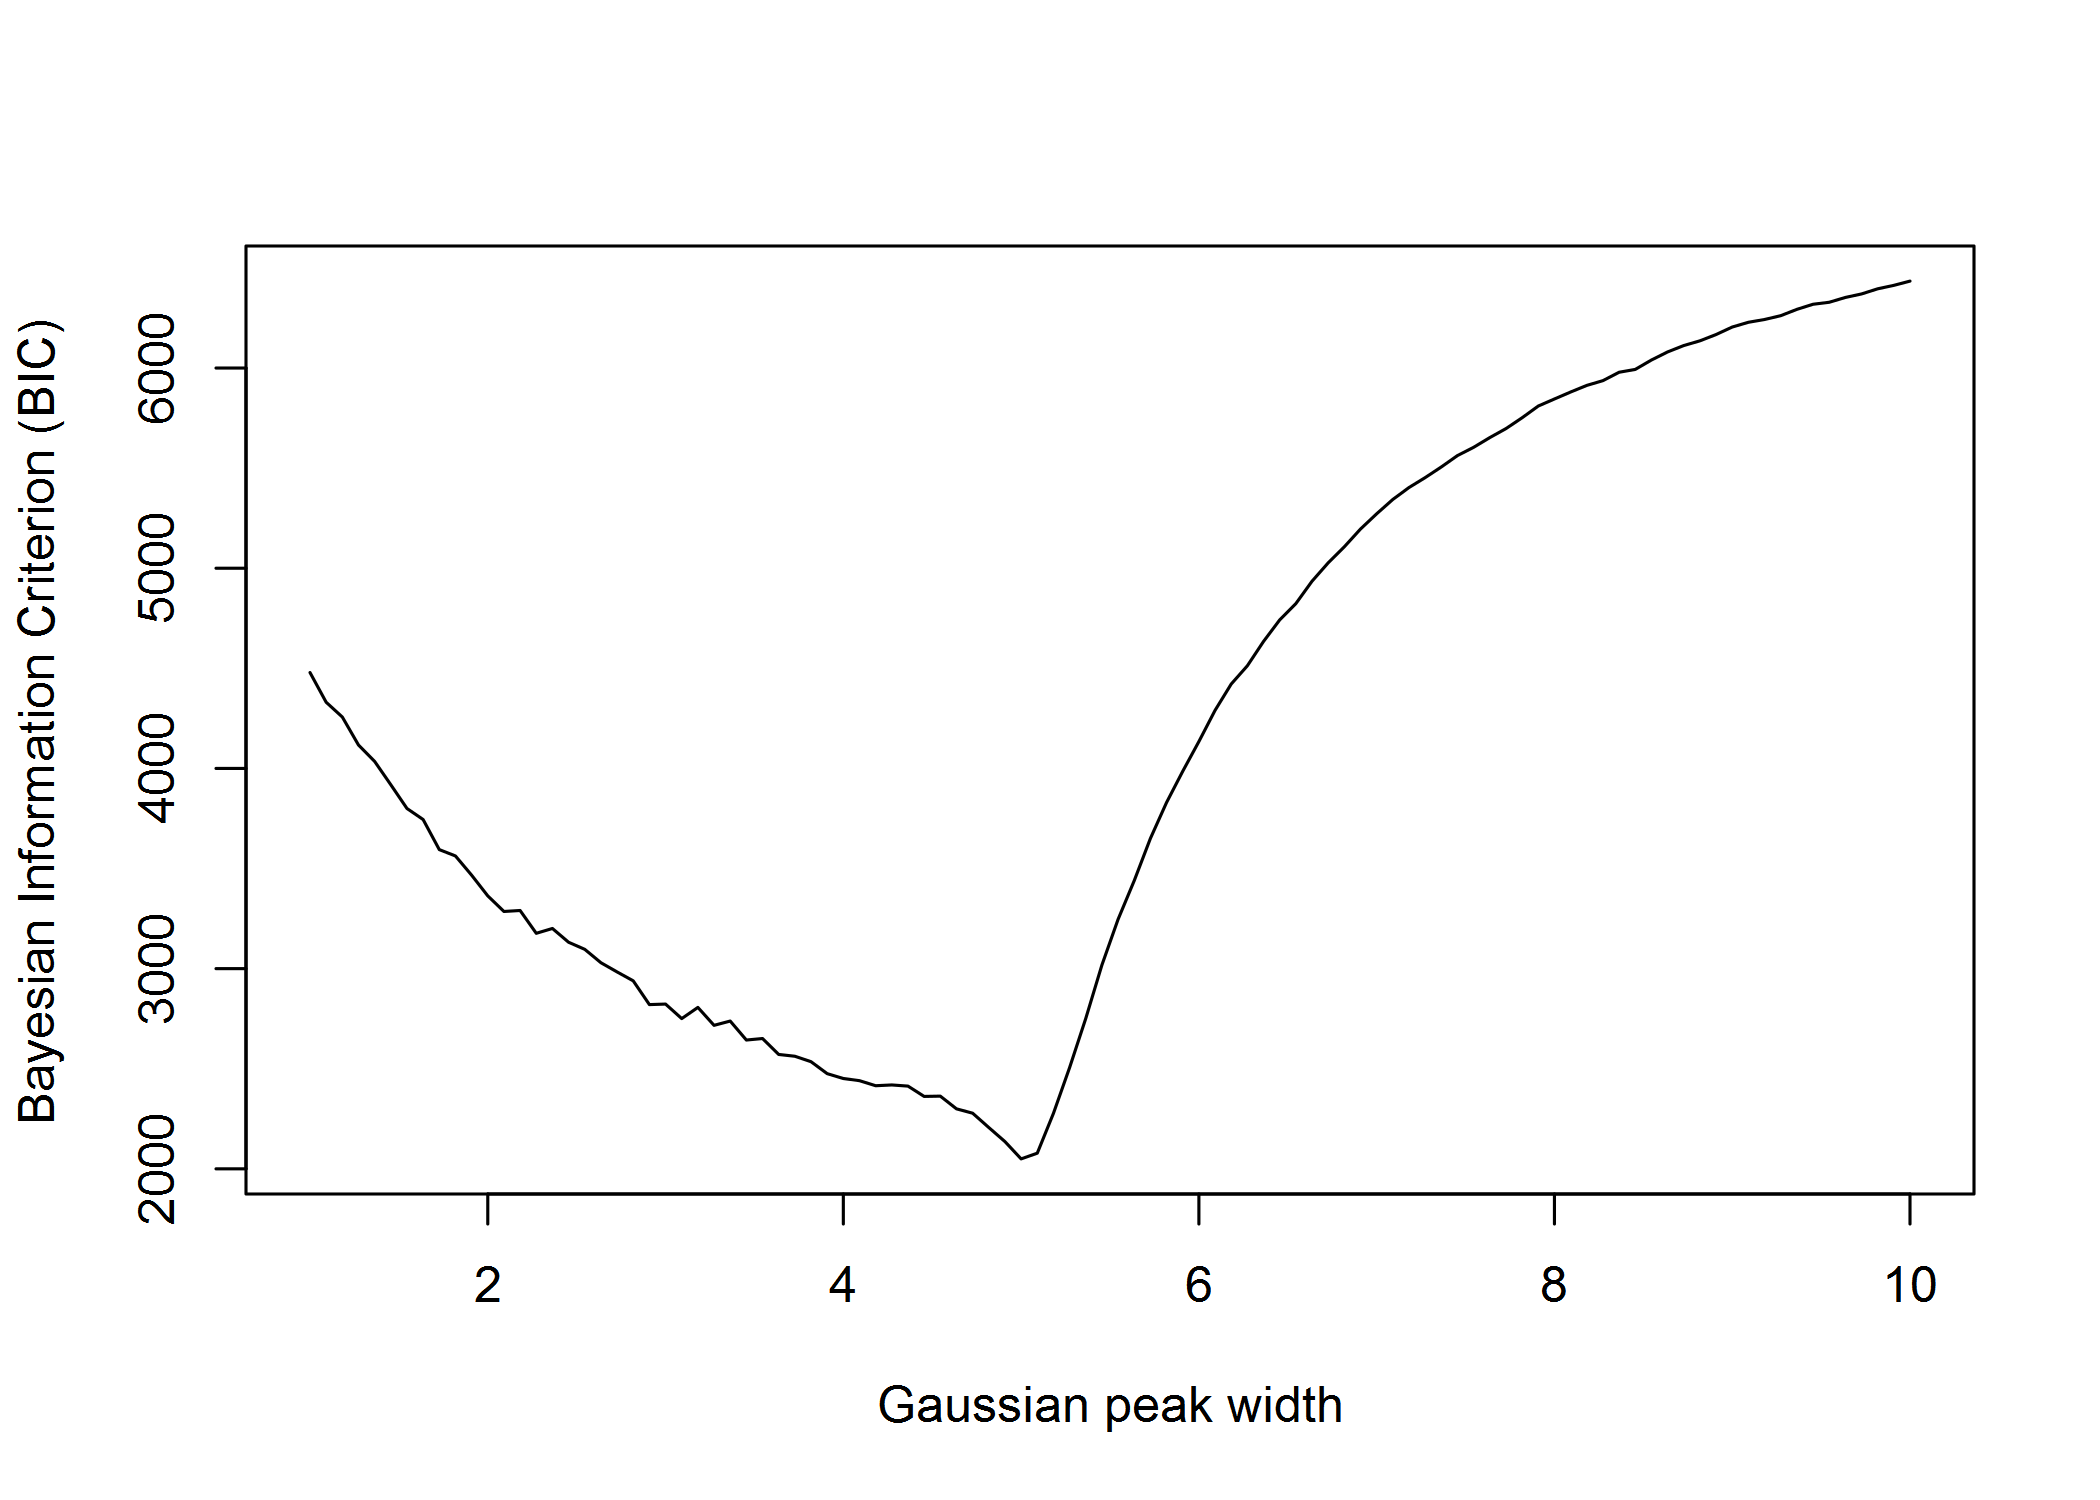
what # estimated Gaussian peak width: 5.02 
BICvals <- sapply(seq(1,10,length.out=100), function(width) fitqual(width) ) 
dev.off()
plot(seq(1,10,length.out=100), BICvals, type="l", ylab="Bayesian Information Criterion (BIC)", xlab="Gaussian peak width")

enter image description here

Only catch seems to be is that this BIC objective function is strictly speaking not 100% smooth (though it's close). If someone would know a better smooth objective function let me know (maybe RSS using 2-fold CV?)! Or any alternative faster method would be cool too!
Using orthogonal matching pursuit might be slightly faster than nnls still (but seemingly not with this implementation), and an nnls solver optimized to use a sparse banded covariate matrix could be faster too (e.g. using the osqp quadratic programming solver, https://stats.stackexchange.com/questions/136563/linear-regression-with-individual-constraints-in-r, or using the nnls function in the RcppML package, https://search.r-project.org/CRAN/refmans/RcppML/html/nnls.html).

EDIT: also tried 2-fold CV - if RSS are calculated on a sqrt scale that also seems to work reasonably well and gives an objective function that is 100% smooth, though it's a little less accurate since the fit is then only done on half of the data (using BIC-based optimization with fit done on every 2 scanlines is as fast and maybe slightly more accurate even with nonsmooth objective function):

# USING 2-FOLD CROSS VALIDATION INSTEAD USING EVEN SCANLINES FOR FITTING & ODD SCANLINES FOR VALIDATION:
# (FASTER OPTION, BUT LITTLE LESS ACCURATE SINCE ONLY HALF OF THE DATA IS USED FOR FITTING)
logRSS.cv = function(width) {
  y1 = y[((1:length(y)) %% 2)==0] # even scanlines for fitting
  y2 = y[((1:length(y)) %% 2)!=0] # odd scanlines for validation
  bandedM = do.call(cbind, lapply(1:length(y1), function (u) gauspeak(1:length(y1), u=u, w=width/2, h=1)))
  require(nnls)
  fit <- nnls(A=bandedM, b=y1) 
  logRSS <- log(sum((sqrt(fit$fitted)-sqrt(y2))^2)) # log(RSS) calculated on sqrt scale
  return(logRSS) 
} 
system.time(what <- optimize(logRSS.cv, interval=c(2, 10), maximum=FALSE, tol=1E-3)$minimum) # 2s for window of 1000, 0.4s for window of 500
what # estimated Gaussian peak width: 4.48
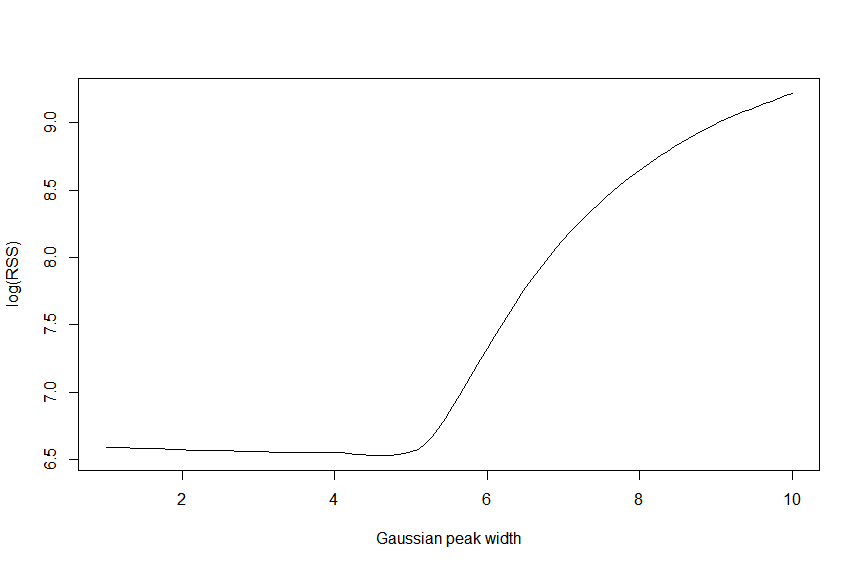
logRSSs <- sapply(seq(1,10,length.out=100), function(width) logRSS.cv(width) ) 
dev.off()
plot(seq(1,10,length.out=100), logRSSs, type="l", ylab="log(RSS)", xlab="Gaussian peak width")
# this objective function seems 100% smooth though

enter image description here

Using BIC, AIC or adjusted R2 as a criterion in combination with 2-fold cross validation also seems to work well...

$\endgroup$
5
  • $\begingroup$ Looks pretty good to me! Nicely done. $\endgroup$
    – Peter K.
    Commented Jan 10, 2019 at 21:05
  • $\begingroup$ I think that it would be worth updating the question with more information about what you were trying to achieve (e.g. your comment towards Cedron Dawg) and how the solution you provided fits that particular use case. If you added a few lines in the intro of your Q and the intro of your A, that would make this a very valuable post in general. All the best. $\endgroup$
    – A_A
    Commented Jan 14, 2019 at 14:48
  • $\begingroup$ I wish the code was MATLAB so I can understand it :-). $\endgroup$
    – Royi
    Commented Aug 20, 2019 at 4:52
  • $\begingroup$ Well it's quite easy really - just install R and RStudio, and step through it line by line using CTRL-ENTER so that you can see what each line does :-) $\endgroup$ Commented Aug 20, 2019 at 11:20
  • $\begingroup$ One can also use Poisson 1/variance weights btw in the nnls() step, using weights = 1/(y+1); nnls(A=bandedM*sqrt(weights), b=y*sqrt(weights)) - that would better take into account the fact that we have Poisson noise here. [It would become similar to Richardson-Lucy deconvolution then, but would then use a closed-form single step weighted least squares approximation; if need be the variance weights could also be further updated based on the fitted values using an IRLS algorithm, like the ones used to solve generalized linear models, as in bwlewis.github.io/GLM/] $\endgroup$ Commented Aug 20, 2019 at 11:26
0
$\begingroup$

There are two problems here:

  1. Find the / a Gaussian
  2. Find all the Gaussians

And you really want to find the Gaussian here, not just fit any curve. One Gaussian has two parameters $\mu, \sigma$ and there might be $N$ of them in a signal.

Even if you knew $N$, the problem is still ill posed because one Gaussian could be formed by the superposition of two or more Gaussians. This "nesting" or "piling up" necessitates the addition of more constraints in the model to be fitted. These constraints are "stiff springs" in the distances between any two $\mu_u, \mu_v$, so that a solution is "penalised" if two means come too close to each other. Which, does work but adds even more parameters to the model if you tried to optimise it as one "object". So, you scatter $N$ Gaussians across this one dimensional signal, run an optimisation step and then evaluate a typical least squares error plus an error term for the distance between the means and let that drive your next decision.

That is going to be difficult. In addition, here, you don't really know $N$.

So this leaves us with iterative methods.

That is:

  1. Fit one Gaussian to the curve
  2. Subtract it from the curve
  3. If the amplitude of the curve is above a threshold that is sufficient to suspect that we can take one more Gaussian out of the signal then go to 1, else terminate.

There are two problems with this approach:

  1. Resolution: For example, I can see at least one specimen in there where there are two Gaussians so close to each other with one having a much higher amplitude than the other. These two are between 0 and 100 in your signal. In this case, almost always, optimisation will select the taller Gaussian. The other similarly problematic case is the twin peaks between 300-400 which might be "seen" as one Gaussian.

  2. Peak Shifting: Consider a bimodal distribution, just two Gaussians. When you subtract one of them (to "take it out"), the nearby Gaussian will appear to shift a bit towards the one you are taking out (if they overlap sufficiently). This is because when two Gaussians overlap they "share" some mass. When you subtract, you take that mass away. Therefore, the results between fitting a bimodal with distinct $\mu_1, \mu_2$ and the results of the iterative process (find $\mu_1$, subtract it, find $\mu_2$) would be different.

Now, these are the pitfalls, depending on your application, you are going to have to accept some and manage others.

But at the end of this process, you are going to be left with a nice set $U$ of tuples $u_n = (\mu_n, \sigma_n), n \in N$ which you can then do whatever you like with (e.g. run a histogram on the $\sigma_n$ and find the most common width, the smallest width, the maximum width, put a derivative on the $\mu_n$s and run a histogram on that and you have mean timings between successive "pulses", etc.

Hope this helps.

$\endgroup$
5
  • $\begingroup$ Problem with this algo is that each of the additional Gaussian fits could not easily be constrained to have all the same widths, or how would you add this constraint? I guess that ideally all the previously fitted peak locations & amplitudes should also be re-optimised upon adding each additional peak, and with nonlinear least squares that would likely become unstable. I've added a method that I know of to do more or less what I want, but the method is slow & not very stable... If you would know of anything better let me know! $\endgroup$ Commented Jan 10, 2019 at 17:23
  • $\begingroup$ Ha just figured out one way of doing it - I posted it as an answer below... Let me know if you would happen to know of a faster method still! $\endgroup$ Commented Jan 10, 2019 at 19:31
  • $\begingroup$ @TomWenseleers Thank you for letting me know. The question went through a lot of iterations, even as I was writing the response and neither mine or Peter.Ks address the "5" width constrain, because it was not there at the time of writing (I think). This is not a complain but another reminder that an accurate question helps a lot. More to the question: I don't understand the "width 5" constraint. This algorithm will give you a set of parameters of the fits. You can shift through them and check if the most frequent width is "5". Otherwise, why constrain the fit to 5? ... $\endgroup$
    – A_A
    Commented Jan 11, 2019 at 11:28
  • $\begingroup$ ...I was with the impression that you did not know neither $\mu$ or $\sigma$ (?). Matching pursuit would allow you to constrain the width range but might still be slow. $\endgroup$
    – A_A
    Commented Jan 11, 2019 at 11:31
  • 1
    $\begingroup$ Yes I think the way I formulated the question first it was not entirely clear that all peaks had to have the same width - sorry for that - so I made that clearer in some edits... Just to be clear - the single universal peak width of all signals is not known a priori though - and it is this peak width of 5 that needs to be estimated... But I figured out a way to do that in the answer I posted now... $\endgroup$ Commented Jan 11, 2019 at 16:38
0
$\begingroup$

Based loosely on A_A's answer, I've coded up:

  • Find the highest peak of the signal and assume this is the true location and height.
  • Find the best width to use for this location and height. Record this width.
  • Subtract this Gaussian from the signal.
  • Repeat for the new signal with Gaussian subtracted.

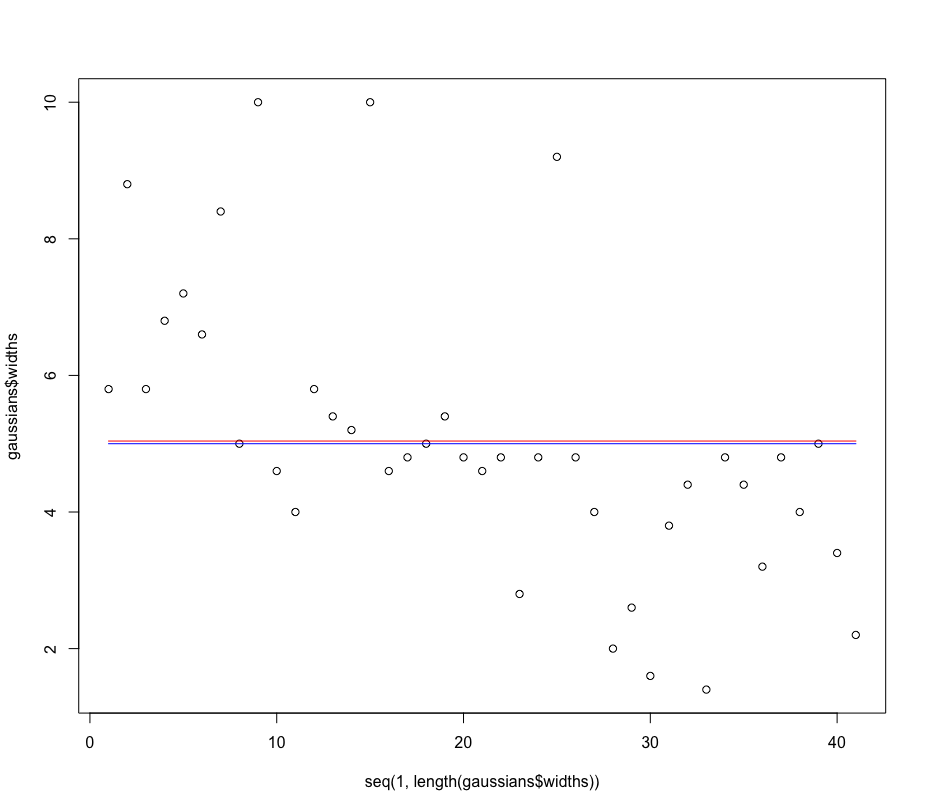
This yields a list of height estimates which can be averaged to find an overall estimate (if they're different). Below is a plot of one example run. The black circles are the individual widths. The blue line is the true width of all Gaussians. The red line is the mean of all the individual widths.

Example run


R Code Only Below

subtract_one_gaussian <- function(x, y, width) {
  max_ix <- which.max(y)
  indices <- max_ix + seq(-5*ceiling(width), 5*ceiling(width))
  indices <- indices[indices > 0]
  indices <- indices[indices < length(y) + 1]
  x_hat <- x[indices] 
  y_hat <- gauspeak(x_hat, x[max_ix], width, y[max_ix])
  y_new <- y 
  y_new[indices] <- abs(y_new[indices] - y_hat)
  result$y_new <- y_new
  result$max_ix <- max_ix
  result$x_hat <- x_hat
  result$y_hat <- y_hat
  return(result)
}

find_best_width <- function(x,y, min_width, max_width)
{
  widths <- seq(min_width, max_width, 0.2)
  errors <- c()
  for (width in widths) 
  {
    result <- subtract_one_gaussian(x, y, width)
    errors <-  c(errors,sum(abs(result$y_new)))
  }

  return(widths[which.min(errors)])
}

find_all_gaussians <- function(x,y) 
{
  best_width <- find_best_width(x,y,1,10)
  result$widths <- c(best_width)
  subtraction_result <- subtract_one_gaussian(x, y, best_width)
  result$locations <- c(result$max_ix)
  for (i in seq(1,40)) {
best_width <- find_best_width(x,subtraction_result$y_new,1,10)
result$widths <- c(result$widths, best_width)
subtraction_result <- subtract_one_gaussian(x, subtraction_result$y_new,best_width)
result$locations <- c(result$locations, subtraction_result$max_ix)
  }

  return(result)
}


gaussians <- find_all_gaussians(x,y)
plot(seq(1,length(gaussians$widths)), gaussians$widths)
lines(c(1,length(gaussians$widths)), mean(gaussians$widths)*c(1,1), col='red')
lines(c(1,length(gaussians$widths)), 5*c(1,1), col='blue')
$\endgroup$
4
  • $\begingroup$ Thanks, but problem with this algo is that each of the additional Gaussian fits could not easily be constrained to have all the same widths (I know that all my peaks are the same), or how would you add this constraint? I guess that ideally all the previously fitted peak locations & amplitudes should also be re-optimised upon adding each additional peak, and with nonlinear least squares that would likely become unstable. Adding a single Gaussian could also be done better, see the R function in the edit of my question above (by fitting a quadratic model on a log scale). $\endgroup$ Commented Jan 10, 2019 at 17:53
  • $\begingroup$ I've also added a method above that I know of to do more or less what I want, but the method is slow & not very stable & does more than I want (estimating the full peak shape as opposed to constraining it to be Gaussian)... If you would know of anything better let me know! $\endgroup$ Commented Jan 10, 2019 at 17:53
  • $\begingroup$ @TomWenseleers Ah! I didn't get that the widths were all the same. I assumed they were all different from , even though their width and amplitudes and the number are unknown but only the amplitudes differ per Gaussian. I'll think about it a bit more. $\endgroup$
    – Peter K.
    Commented Jan 10, 2019 at 17:56
  • $\begingroup$ Ha just figured out one way of doing it - I posted it as an answer below... Let me know if you would happen to know of a faster method still! $\endgroup$ Commented Jan 10, 2019 at 19:31

Your Answer

By clicking “Post Your Answer”, you agree to our terms of service and acknowledge you have read our privacy policy.

Not the answer you're looking for? Browse other questions tagged or ask your own question.