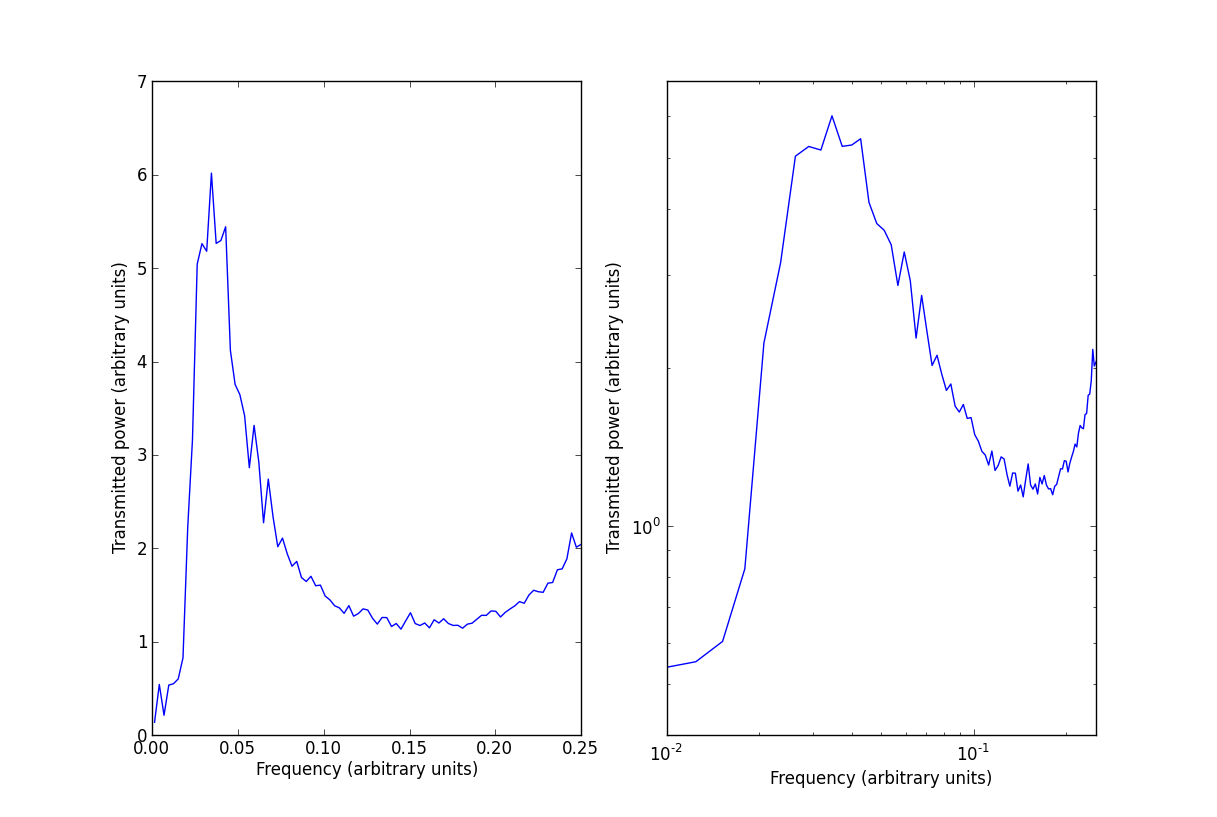
I'm trying to determine the effect of a particular non-linear process on my data. From simulations, I can measure the power spectra of "ideal" and "processed" images and take their ratio, which (I think) should correspond to some sort of filter or filtering process.
So, are there any filters, or filtering processes, that look (vaguely) like the attached plots? The two plots are the same data in linear-linear (left) and log-log (right) space.

More detail: I have a pipeline that takes timestream data where each point on the timestream is associated with a point in an image. Some "cleaning" (PCA subtraction) is performed on the timestreams before creating the images. My goal is to determine the effect the timestream processing has on the resulting image, with the end goal being to replicate the effect on images for which no comparable timestream data is available. The data is coming from bolometer arrays and these are images of the sky at millimeter wavelengths.
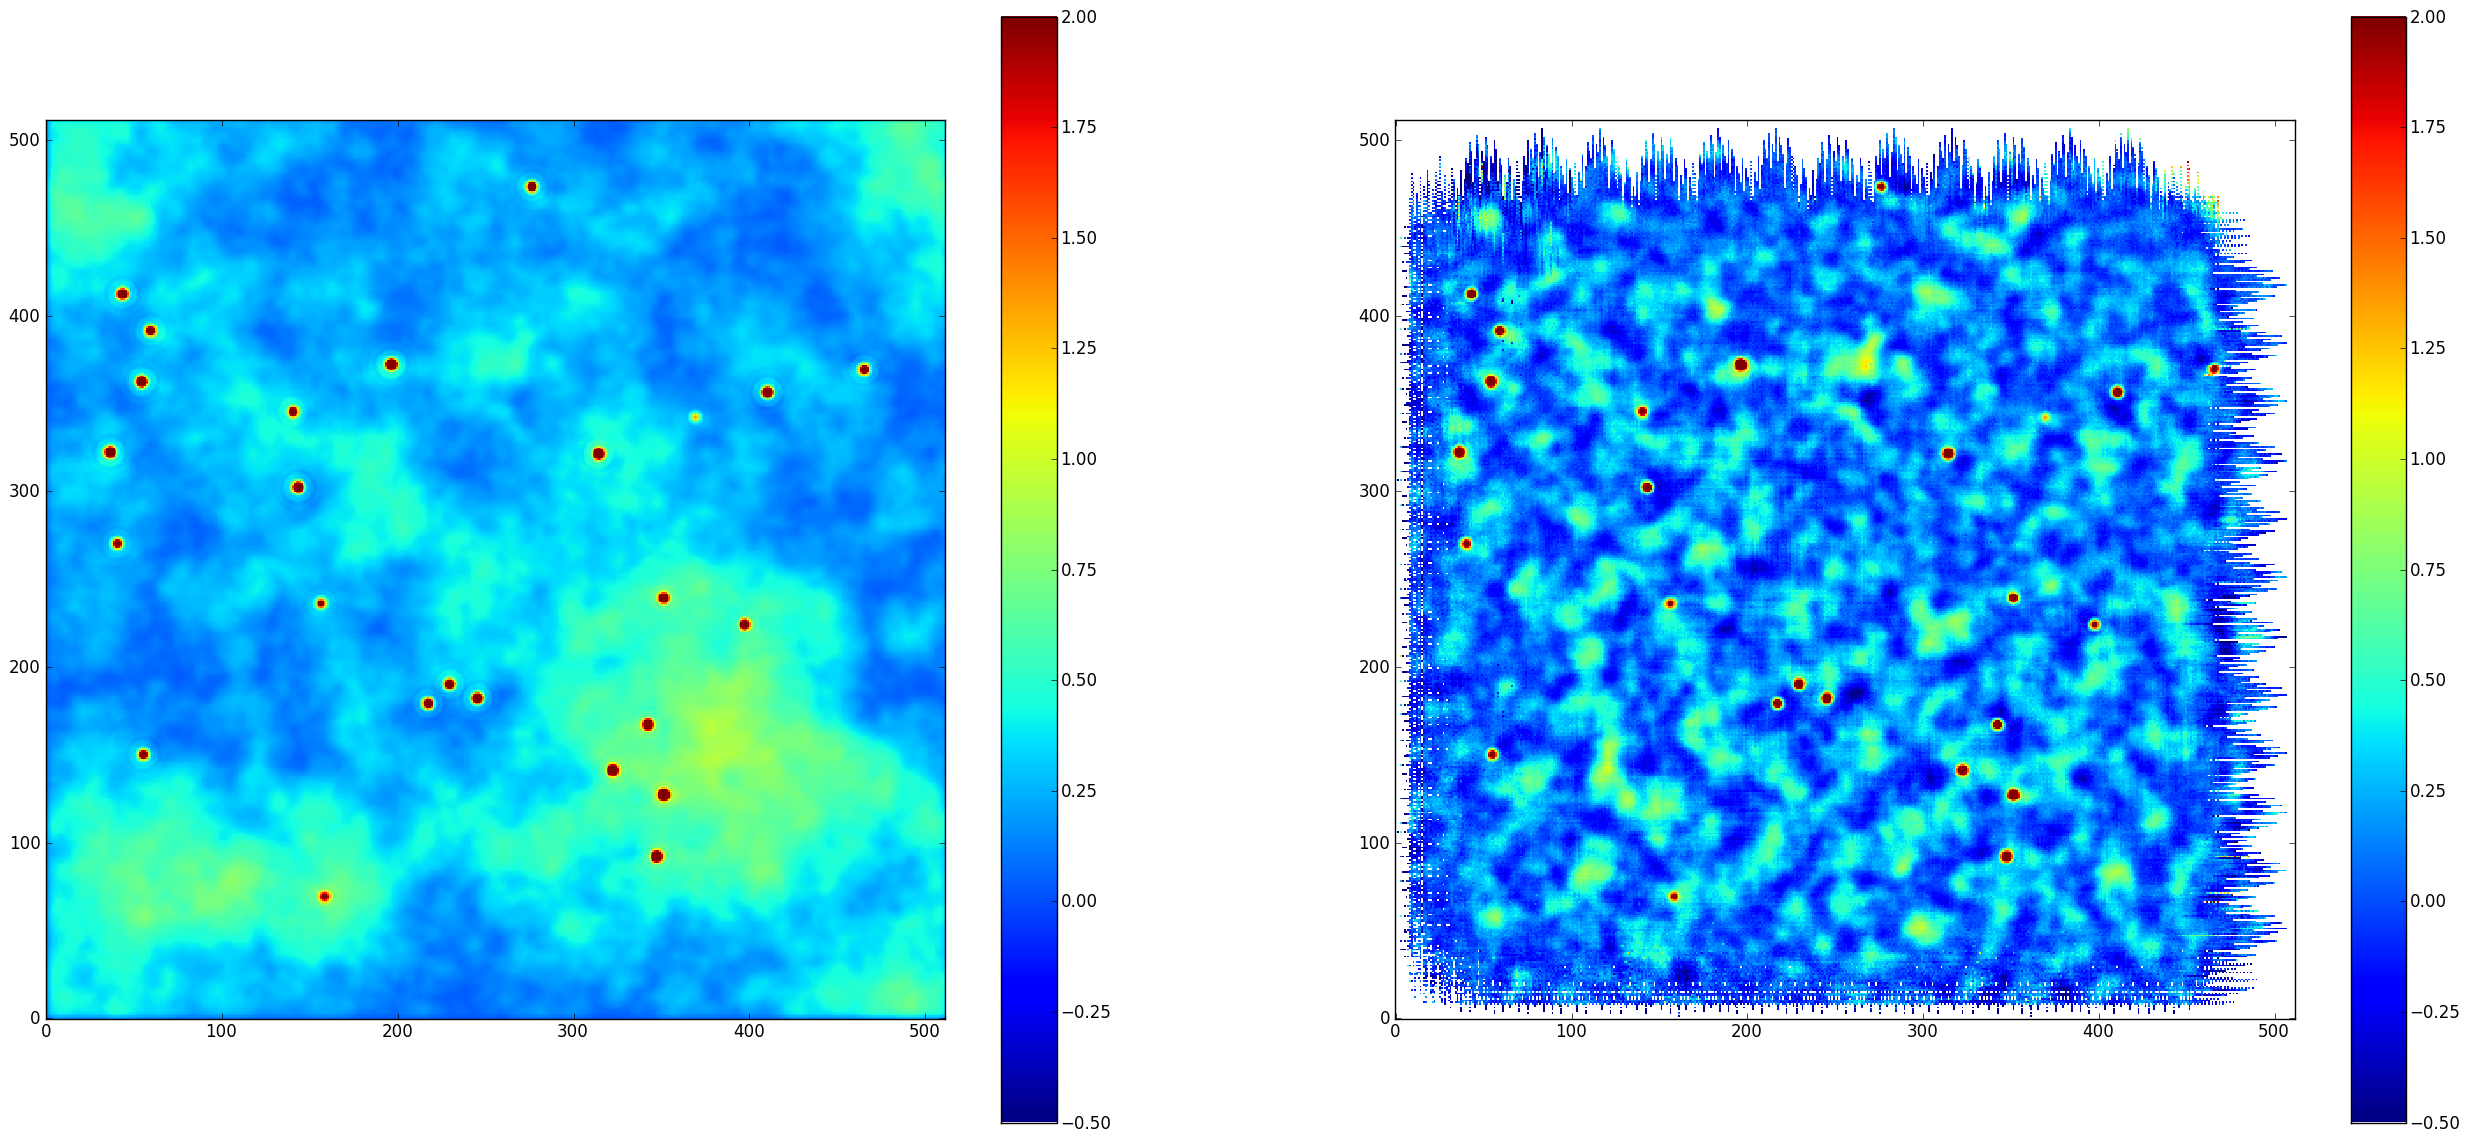
Here are the simulated images. Left is before, right is after processing. The spiky points around the edges are where there is no timestream data.

See also this ipython notebook http://nbviewer.ipython.org/4393835/ for a little analysis.
Since it is entirely possible that the timestream filtering process cannot be represented by any filter in image space, an answer addressing "how do I approximate these filter functions" is appropriate.
