remove paython part
Source Link

New Info: When exchanging Window1 with Window2, the results of CC exchange are as well. Meaning the left image CC_gsignal will look like the current cc_fftwtools and vice versa.

Edit: As per @OverLordGoldDragon's request, I add below a Python version using Scipy as well as FFT approach:

import numpy as np
import matplotlib.pyplot as plt
from numpy.fft import fft, ifft, fft2, ifft2, ifftshift
from PIL import Image
from scipy import signal
Window1 =array([[0., 0., 0., 0., 0., 0., 0., 0.],
       [0., 0., 0., 0., 0., 0., 0., 0.],
       [0., 0., 1., 1., 1., 1., 0., 0.],
       [0., 0., 1., 1., 1., 0., 0., 0.],
       [0., 0., 1., 1., 1., 0., 0., 0.],
       [0., 0., 0., 0., 0., 0., 0., 0.],
       [0., 0., 0., 0., 0., 0., 0., 0.],
       [0., 0., 0., 0., 0., 0., 0., 0.]])

Window2 = array([[0., 0., 0., 0., 0., 0., 0., 0.],
       [0., 1., 1., 1., 1., 0., 0., 0.],
       [0., 1., 1., 1., 0., 0., 0., 0.],
       [0., 1., 1., 1., 0., 0., 0., 0.],
       [0., 0., 0., 0., 0., 0., 0., 0.],
       [0., 0., 0., 0., 0., 0., 0., 0.],
       [0., 0., 0., 0., 0., 0., 1., 1.],
       [0., 0., 0., 0., 0., 0., 1., 1.]])

corr_scipy = signal.correlate2d(Window1, Window2, boundary='fill', mode='full')

def cross_correlate_2d(x, h):
    h = ifftshift(ifftshift(h, axes=0), axes=1)
    return ifft2(fft2(x) * np.conj(fft2(h))).real
  
# no zero padding  
corr_fft = cross_correlate_2d(Window1, Window2)
fig = plt.figure(figsize=(8, 8))
fig.add_subplot(1,2, 1); plt.imshow(corr_scipy, cmap='turbo')
fig.add_subplot(1,2, 2); plt.imshow(corr_fft, cmap='turbo')
plt.show()

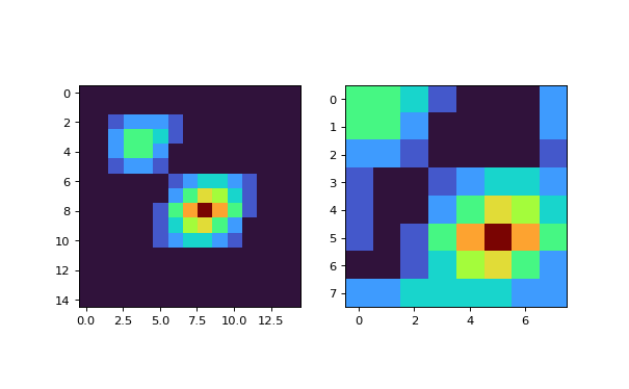
enter image description here

New Info: When exchanging Window1 with Window2, the results of CC exchange as well. Meaning the left image CC_gsignal will look like the current cc_fftwtools and vice versa.

Edit: As per @OverLordGoldDragon's request, I add below a Python version using Scipy as well as FFT approach:

import numpy as np
import matplotlib.pyplot as plt
from numpy.fft import fft, ifft, fft2, ifft2, ifftshift
from PIL import Image
from scipy import signal
Window1 =array([[0., 0., 0., 0., 0., 0., 0., 0.],
       [0., 0., 0., 0., 0., 0., 0., 0.],
       [0., 0., 1., 1., 1., 1., 0., 0.],
       [0., 0., 1., 1., 1., 0., 0., 0.],
       [0., 0., 1., 1., 1., 0., 0., 0.],
       [0., 0., 0., 0., 0., 0., 0., 0.],
       [0., 0., 0., 0., 0., 0., 0., 0.],
       [0., 0., 0., 0., 0., 0., 0., 0.]])

Window2 = array([[0., 0., 0., 0., 0., 0., 0., 0.],
       [0., 1., 1., 1., 1., 0., 0., 0.],
       [0., 1., 1., 1., 0., 0., 0., 0.],
       [0., 1., 1., 1., 0., 0., 0., 0.],
       [0., 0., 0., 0., 0., 0., 0., 0.],
       [0., 0., 0., 0., 0., 0., 0., 0.],
       [0., 0., 0., 0., 0., 0., 1., 1.],
       [0., 0., 0., 0., 0., 0., 1., 1.]])

corr_scipy = signal.correlate2d(Window1, Window2, boundary='fill', mode='full')

def cross_correlate_2d(x, h):
    h = ifftshift(ifftshift(h, axes=0), axes=1)
    return ifft2(fft2(x) * np.conj(fft2(h))).real
  
# no zero padding  
corr_fft = cross_correlate_2d(Window1, Window2)
fig = plt.figure(figsize=(8, 8))
fig.add_subplot(1,2, 1); plt.imshow(corr_scipy, cmap='turbo')
fig.add_subplot(1,2, 2); plt.imshow(corr_fft, cmap='turbo')
plt.show()

enter image description here

New Info: When exchanging Window1 with Window2, the results of CC exchange are as well. Meaning the left image CC_gsignal will look like the current cc_fftwtools and vice versa.

New Info
Source Link

New Info: When exchanging Window1 with Window2, the results of CC exchange as well. Meaning the left image CC_gsignal will look like the current cc_fftwtools and vice versa.

New Info: When exchanging Window1 with Window2, the results of CC exchange as well. Meaning the left image CC_gsignal will look like the current cc_fftwtools and vice versa.

@OverLordGoldDragon's request
Source Link

Edit: As per @OverLordGoldDragon's request, I add below a Python version using Scipy as well as FFT approach:

import numpy as np
import matplotlib.pyplot as plt
from numpy.fft import fft, ifft, fft2, ifft2, ifftshift
from PIL import Image
from scipy import signal
Window1 =array([[0., 0., 0., 0., 0., 0., 0., 0.],
       [0., 0., 0., 0., 0., 0., 0., 0.],
       [0., 0., 1., 1., 1., 1., 0., 0.],
       [0., 0., 1., 1., 1., 0., 0., 0.],
       [0., 0., 1., 1., 1., 0., 0., 0.],
       [0., 0., 0., 0., 0., 0., 0., 0.],
       [0., 0., 0., 0., 0., 0., 0., 0.],
       [0., 0., 0., 0., 0., 0., 0., 0.]])

Window2 = array([[0., 0., 0., 0., 0., 0., 0., 0.],
       [0., 1., 1., 1., 1., 0., 0., 0.],
       [0., 1., 1., 1., 0., 0., 0., 0.],
       [0., 1., 1., 1., 0., 0., 0., 0.],
       [0., 0., 0., 0., 0., 0., 0., 0.],
       [0., 0., 0., 0., 0., 0., 0., 0.],
       [0., 0., 0., 0., 0., 0., 1., 1.],
       [0., 0., 0., 0., 0., 0., 1., 1.]])

corr_scipy = signal.correlate2d(Window1, Window2, boundary='fill', mode='full')

def cross_correlate_2d(x, h):
    h = ifftshift(ifftshift(h, axes=0), axes=1)
    return ifft2(fft2(x) * np.conj(fft2(h))).real
  
# no zero padding  
corr_fft = cross_correlate_2d(Window1, Window2)
fig = plt.figure(figsize=(8, 8))
fig.add_subplot(1,2, 1); plt.imshow(corr_scipy, cmap='turbo')
fig.add_subplot(1,2, 2); plt.imshow(corr_fft, cmap='turbo')
plt.show()

enter image description here

typo at gsignal::xcorr2(Window1, Window2)
Source Link
Loading
add vertically & horizontaly
Source Link
Loading
Source Link
Loading