added 802 characters in body
Source Link

This will be helpful for You to interpret kurtogram https://www.mathworks.com/help/predmaint/ug/Rolling-Element-Bearing-Fault-Diagnosis.html

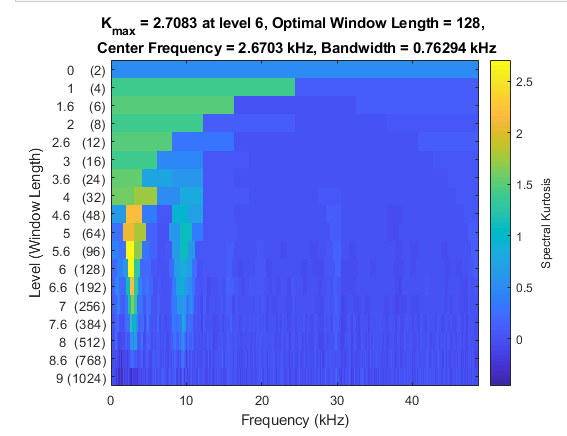
enter image description here

If we look on the results the most important elements are:

Kmax = 2.7083 - is maximum value or kurtosis

Optimal Window Length = 128 - this value we can use to calculate spectral kurtosis

Center Frequency = 2.6703 kHz and Bandwidttch = 0.76294 kHz - this two parmateres we can use do design band pass filter

The kurtogram is used in bearing fault diagnosis to extract the most impulsive signal from the signal. Base on this example we can say: if we select center frequency = 2.6703 kHz and bandwidth = 0.76294 kHz we can obtain a signal after filtration that gives the most impulsive characteristic. Using these parmaters we can calculate the envelope spectrum for the final diagnostic.

Source Link