deleted 4 characters in body
Source Link
Andy Walls
  • 2.7k
  • 1
  • 10
  • 11

The inverse DFT is

$$f[n] = \dfrac{1}{N} \sum_{k=0}^{N-1} F[k] e^{j2\pi\frac{k}{N}n}$$

You were computing

$$\begin{align*}g[n+d] &= \dfrac{1}{N} \sum_{k=0}^{N-1} F[k] e^{j2\pi\frac{k}{N}(n+d)}\\ \\ &= \dfrac{1}{N} \sum_{k=0}^{N-1} \left(F[k]e^{j2\pi\frac{k}{N}d}\right) e^{j2\pi\frac{k}{N}n}\\ \\ &= \mathrm{IDFT}\left\{F[k]e^{j2\pi\frac{d}{N}k}\right\}\\ \\ &= \mathrm{IDFT}\left\{F[k]\right\} \ast \mathrm{IDFT}\left\{e^{j2\pi\frac{d}{N}k}\right\}\\ \\ &= f[n] \ast \text{(a shifted sampled sinc() function with aliasing)} \\ \end{align*}$$

where $\ast$ denotes circular convolution.

The "shifted sampled sinc() function with aliasing" comes from taking the IDFT of a rectangularly windowed, frequency varying, exponential function.

The frequency varying exponential is the source of the shift.

The rectangular window (over the N points in the frequency domain), is the source of the sinc() function.

The limited time domain (N samples), trying to fit in the infinitely long sinc() function, manifests as aliasing.

The reason you don't notice this with shifts, $d$, that are an integer is that the sampled sinc() function looks like $[0, \dots, 0, 1, 0,\dots,0]$ for the case of an integer shift.

A "shifted sampled sinc() function with aliasing" is a horrible interpolation filter, as you may have noticed.

Update

The following Octave (Matlab clone) script demonstrates the results of this "IDFT interpolation" technique to interpolate the original signal at intersample increments of $0.1$ samples:

N = 10;
x = [0:N-1];
f = sin(x*2*pi/N);
F = fft(f, N);

D = 10;
d = [0:D-1]/D;

x2 = ones(D,1)*x + d.'*ones(1,N);
F2 = ones(D,1)*F .* exp(1i*2*pi*d.'*ones(1,N)/N.*(ones(D,1)*x));
f2 = ifft(F2, N, 2);

x3 = reshape(x2, 1, D*N);
f3 = reshape(f2, 1, D*N);

fideal = sin(x3*2*pi/N);
figure(1);
plot(x3, abs(f3), 'x-;IDFT Interp;', x3, abs(fideal), 'o-;Ideal Interp;');
title('Interpolated Signal Magnitude');
xlabel('Sample index (samples)');
ylabel('Magnitude');
grid on;

figure(2);
plot(x3, arg(f3), 'x-;IDFT Interp;', x3, arg(fideal), 'o-;Ideal Interp;');
title('Interpolated Signal Phase');
xlabel('Sample index (samples)');
ylabel('Phase (radians)');
grid on;

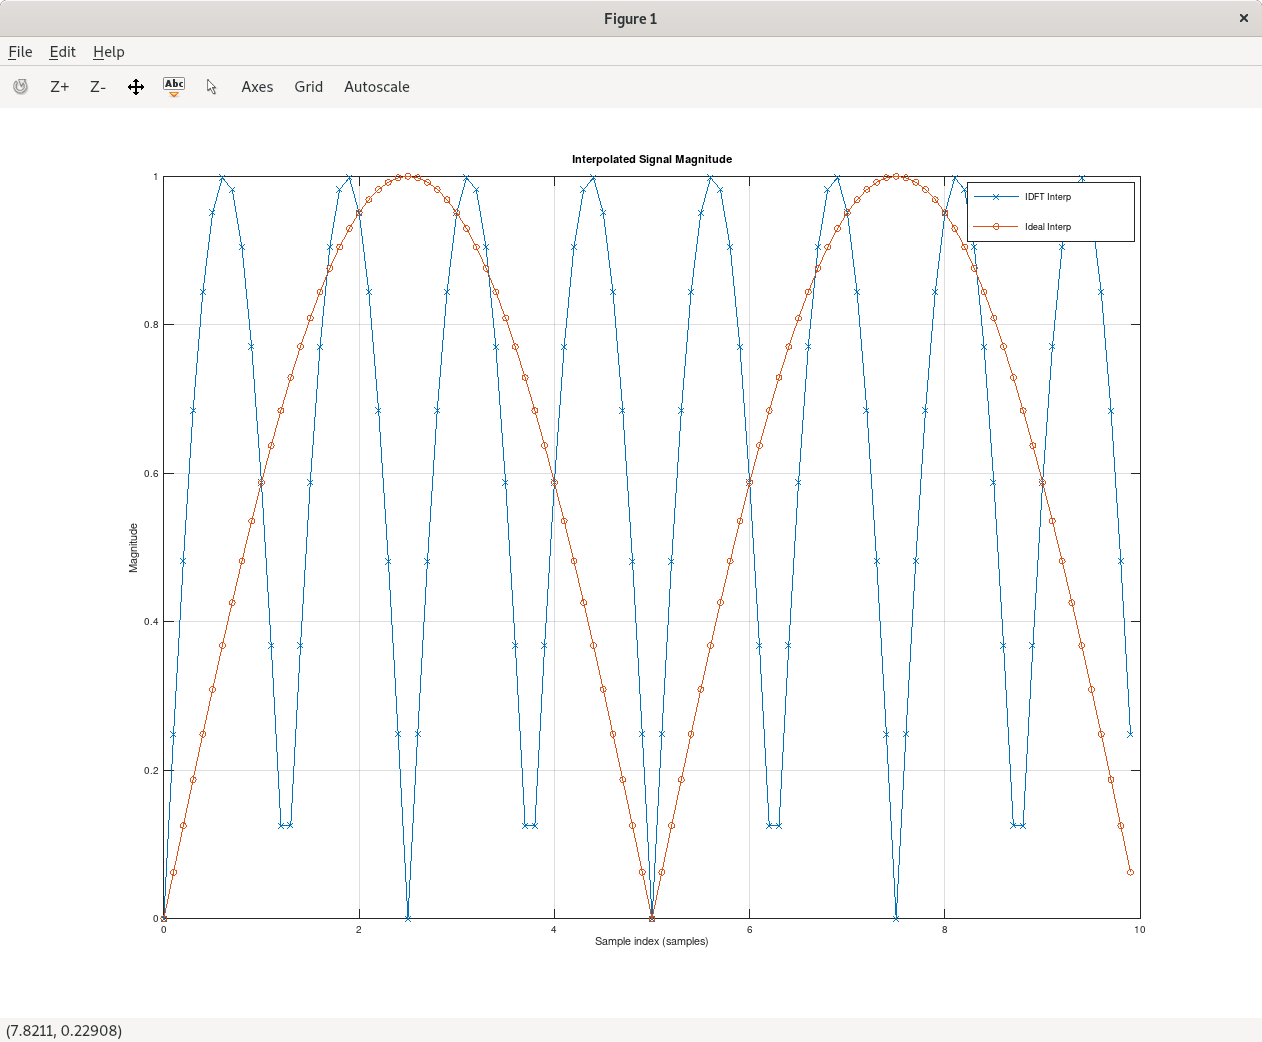
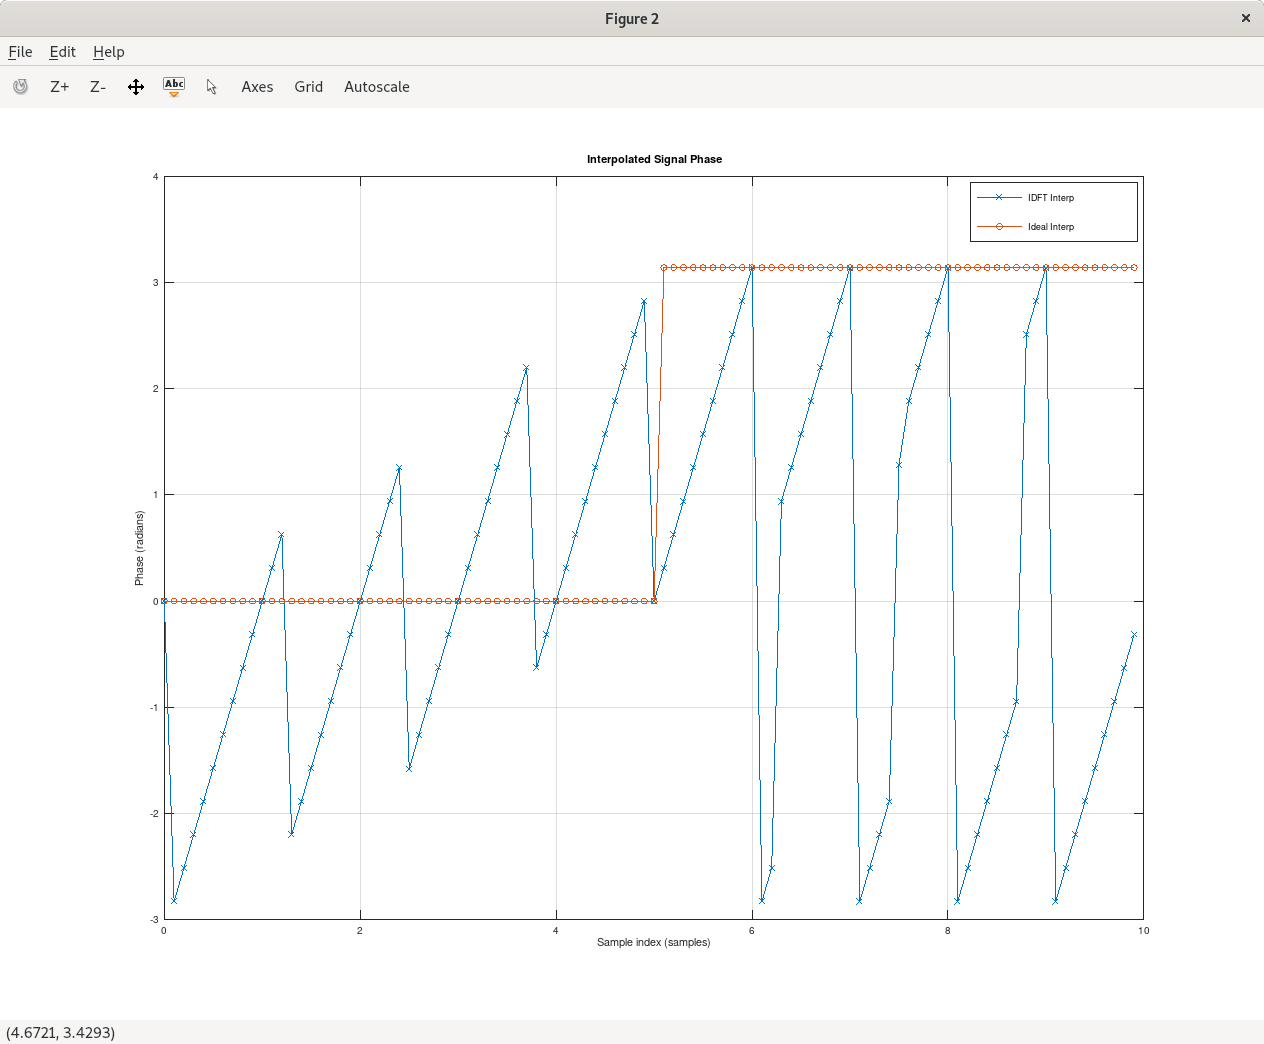
Here are the output magnitude and phase plots of the "IDFT interpolated" signal vs. the ideal interpolated signal:

enter image description here

enter image description here

At integer sample indices, the magnitude and phase of the two signals exactly match, so the DFT and IDFT are correct. No surprise there.

At non-integer sample indices, the phase indicates the signal is complex valued, and the magnitude can be just as wrong as it could possible be, such as the values at sample index 2.5.

The magnitude of the the incorrect signal might be something like a double4x frequency sine wave of the original sine wave, but I don't know for sure. That relationship might just be a special case that happens because of the parameters picked in this particular example.

The inverse DFT is

$$f[n] = \dfrac{1}{N} \sum_{k=0}^{N-1} F[k] e^{j2\pi\frac{k}{N}n}$$

You were computing

$$\begin{align*}g[n+d] &= \dfrac{1}{N} \sum_{k=0}^{N-1} F[k] e^{j2\pi\frac{k}{N}(n+d)}\\ \\ &= \dfrac{1}{N} \sum_{k=0}^{N-1} \left(F[k]e^{j2\pi\frac{k}{N}d}\right) e^{j2\pi\frac{k}{N}n}\\ \\ &= \mathrm{IDFT}\left\{F[k]e^{j2\pi\frac{d}{N}k}\right\}\\ \\ &= \mathrm{IDFT}\left\{F[k]\right\} \ast \mathrm{IDFT}\left\{e^{j2\pi\frac{d}{N}k}\right\}\\ \\ &= f[n] \ast \text{(a shifted sampled sinc() function with aliasing)} \\ \end{align*}$$

where $\ast$ denotes circular convolution.

The "shifted sampled sinc() function with aliasing" comes from taking the IDFT of a rectangularly windowed, frequency varying, exponential function.

The frequency varying exponential is the source of the shift.

The rectangular window (over the N points in the frequency domain), is the source of the sinc() function.

The limited time domain (N samples), trying to fit in the infinitely long sinc() function, manifests as aliasing.

The reason you don't notice this with shifts, $d$, that are an integer is that the sampled sinc() function looks like $[0, \dots, 0, 1, 0,\dots,0]$ for the case of an integer shift.

A "shifted sampled sinc() function with aliasing" is a horrible interpolation filter, as you may have noticed.

Update

The following Octave (Matlab clone) script demonstrates the results of this "IDFT interpolation" technique to interpolate the original signal at intersample increments of $0.1$ samples:

N = 10;
x = [0:N-1];
f = sin(x*2*pi/N);
F = fft(f, N);

D = 10;
d = [0:D-1]/D;

x2 = ones(D,1)*x + d.'*ones(1,N);
F2 = ones(D,1)*F .* exp(1i*2*pi*d.'*ones(1,N)/N.*(ones(D,1)*x));
f2 = ifft(F2, N, 2);

x3 = reshape(x2, 1, D*N);
f3 = reshape(f2, 1, D*N);

fideal = sin(x3*2*pi/N);
figure(1);
plot(x3, abs(f3), 'x-;IDFT Interp;', x3, abs(fideal), 'o-;Ideal Interp;');
title('Interpolated Signal Magnitude');
xlabel('Sample index (samples)');
ylabel('Magnitude');
grid on;

figure(2);
plot(x3, arg(f3), 'x-;IDFT Interp;', x3, arg(fideal), 'o-;Ideal Interp;');
title('Interpolated Signal Phase');
xlabel('Sample index (samples)');
ylabel('Phase (radians)');
grid on;

Here are the output magnitude and phase plots of the "IDFT interpolated" signal vs. the ideal interpolated signal:

enter image description here

enter image description here

At integer sample indices, the magnitude and phase of the two signals exactly match, so the DFT and IDFT are correct. No surprise there.

At non-integer sample indices, the phase indicates the signal is complex valued, and the magnitude can be just as wrong as it could possible be, such as the values at sample index 2.5.

The magnitude of the the incorrect signal might be something like a double frequency sine wave of the original sine wave, but I don't know for sure. That relationship might just be a special case that happens because of the parameters picked in this particular example.
The inverse DFT is

$$f[n] = \dfrac{1}{N} \sum_{k=0}^{N-1} F[k] e^{j2\pi\frac{k}{N}n}$$

You were computing

$$\begin{align*}g[n+d] &= \dfrac{1}{N} \sum_{k=0}^{N-1} F[k] e^{j2\pi\frac{k}{N}(n+d)}\\ \\ &= \dfrac{1}{N} \sum_{k=0}^{N-1} \left(F[k]e^{j2\pi\frac{k}{N}d}\right) e^{j2\pi\frac{k}{N}n}\\ \\ &= \mathrm{IDFT}\left\{F[k]e^{j2\pi\frac{d}{N}k}\right\}\\ \\ &= \mathrm{IDFT}\left\{F[k]\right\} \ast \mathrm{IDFT}\left\{e^{j2\pi\frac{d}{N}k}\right\}\\ \\ &= f[n] \ast \text{(a shifted sampled sinc() function with aliasing)} \\ \end{align*}$$

where $\ast$ denotes circular convolution.

The "shifted sampled sinc() function with aliasing" comes from taking the IDFT of a rectangularly windowed, frequency varying, exponential function.

The frequency varying exponential is the source of the shift.

The rectangular window (over the N points in the frequency domain), is the source of the sinc() function.

The limited time domain (N samples), trying to fit in the infinitely long sinc() function, manifests as aliasing.

The reason you don't notice this with shifts, $d$, that are an integer is that the sampled sinc() function looks like $[0, \dots, 0, 1, 0,\dots,0]$ for the case of an integer shift.

A "shifted sampled sinc() function with aliasing" is a horrible interpolation filter, as you may have noticed.

Update

The following Octave (Matlab clone) script demonstrates the results of this "IDFT interpolation" technique to interpolate the original signal at intersample increments of $0.1$ samples:

N = 10;
x = [0:N-1];
f = sin(x*2*pi/N);
F = fft(f, N);

D = 10;
d = [0:D-1]/D;

x2 = ones(D,1)*x + d.'*ones(1,N);
F2 = ones(D,1)*F .* exp(1i*2*pi*d.'*ones(1,N)/N.*(ones(D,1)*x));
f2 = ifft(F2, N, 2);

x3 = reshape(x2, 1, D*N);
f3 = reshape(f2, 1, D*N);

fideal = sin(x3*2*pi/N);
figure(1);
plot(x3, abs(f3), 'x-;IDFT Interp;', x3, abs(fideal), 'o-;Ideal Interp;');
title('Interpolated Signal Magnitude');
xlabel('Sample index (samples)');
ylabel('Magnitude');
grid on;

figure(2);
plot(x3, arg(f3), 'x-;IDFT Interp;', x3, arg(fideal), 'o-;Ideal Interp;');
title('Interpolated Signal Phase');
xlabel('Sample index (samples)');
ylabel('Phase (radians)');
grid on;

Here are the output magnitude and phase plots of the "IDFT interpolated" signal vs. the ideal interpolated signal:

enter image description here

enter image description here

At integer sample indices, the magnitude and phase of the two signals exactly match, so the DFT and IDFT are correct. No surprise there.

At non-integer sample indices, the phase indicates the signal is complex valued, and the magnitude can be just as wrong as it could possible be, such as the values at sample index 2.5.

The magnitude of the the incorrect signal might be something like a 4x frequency sine wave of the original sine wave, but I don't know for sure. That relationship might just be a special case that happens because of the parameters picked in this particular example.

added 1918 characters in body
Source Link
Andy Walls
  • 2.7k
  • 1
  • 10
  • 11

The inverse DFT is

$$f[n] = \dfrac{1}{N} \sum_{k=0}^{N-1} F[k] e^{j2\pi\frac{k}{N}n}$$

You were computing

$$\begin{align*}g[n+d] &= \dfrac{1}{N} \sum_{k=0}^{N-1} F[k] e^{j2\pi\frac{k}{N}(n+d)}\\ \\ &= \dfrac{1}{N} \sum_{k=0}^{N-1} \left(F[k]e^{j2\pi\frac{k}{N}d}\right) e^{j2\pi\frac{k}{N}n}\\ \\ &= \mathrm{IDFT}\left\{F[k]e^{j2\pi\frac{d}{N}k}\right\}\\ \\ &= \mathrm{IDFT}\left\{F[k]\right\} \ast \mathrm{IDFT}\left\{e^{j2\pi\frac{d}{N}k}\right\}\\ \\ &= f[n] \ast \text{(a shifted sampled sinc() function with aliasing)} \\ \end{align*}$$

where $\ast$ denotes circular convolution.

The "shifted sampled sinc() function with aliasing" comes from taking the IDFT of a rectangularly windowed, frequency varying, exponential function.

The frequency varying exponential is the source of the shift.

The rectangular window (over the N points in the frequency domain), is the source of the sinc() function.

The limited time domain (N samples), trying to fit in the infinitely long sinc() function, manifests as aliasing.

The reason you don't notice this with shifts, $d$, that are an integer is that the sampled sinc() function looks like $[0, \dots, 0, 1, 0,\dots,0]$ for the case of an integer shift.

A "shifted sampled sinc() function with aliasing" is a horrible interpolation filter, as you may have noticed.

Update

The following Octave (Matlab clone) script demonstrates the results of this "IDFT interpolation" technique to interpolate the original signal at intersample increments of $0.1$ samples:

N = 10;
x = [0:N-1];
f = sin(x*2*pi/N);
F = fft(f, N);

D = 10;
d = [0:D-1]/D;

x2 = ones(D,1)*x + d.'*ones(1,N);
F2 = ones(D,1)*F .* exp(1i*2*pi*d.'*ones(1,N)/N.*(ones(D,1)*x));
f2 = ifft(F2, N, 2);

x3 = reshape(x2, 1, D*N);
f3 = reshape(f2, 1, D*N);

fideal = sin(x3*2*pi/N);
figure(1);
plot(x3, abs(f3), 'x-;IDFT Interp;', x3, abs(fideal), 'o-;Ideal Interp;');
title('Interpolated Signal Magnitude');
xlabel('Sample index (samples)');
ylabel('Magnitude');
grid on;

figure(2);
plot(x3, arg(f3), 'x-;IDFT Interp;', x3, arg(fideal), 'o-;Ideal Interp;');
title('Interpolated Signal Phase');
xlabel('Sample index (samples)');
ylabel('Phase (radians)');
grid on;

Here are the output magnitude and phase plots of the "IDFT interpolated" signal vs. the ideal interpolated signal:

enter image description here

enter image description here

At integer sample indices, the magnitude and phase of the two signals exactly match, so the DFT and IDFT are correct. No surprise there.

At non-integer sample indices, the phase indicates the signal is complex valued, and the magnitude can be just as wrong as it could possible be, such as the values at sample index 2.5.

The magnitude of the the incorrect signal might be something like a double frequency sine wave of the original sine wave, but I don't know for sure. That relationship might just be a special case that happens because of the parameters picked in this particular example.

The inverse DFT is

$$f[n] = \dfrac{1}{N} \sum_{k=0}^{N-1} F[k] e^{j2\pi\frac{k}{N}n}$$

You were computing

$$\begin{align*}g[n+d] &= \dfrac{1}{N} \sum_{k=0}^{N-1} F[k] e^{j2\pi\frac{k}{N}(n+d)}\\ \\ &= \dfrac{1}{N} \sum_{k=0}^{N-1} \left(F[k]e^{j2\pi\frac{k}{N}d}\right) e^{j2\pi\frac{k}{N}n}\\ \\ &= \mathrm{IDFT}\left\{F[k]e^{j2\pi\frac{d}{N}k}\right\}\\ \\ &= \mathrm{IDFT}\left\{F[k]\right\} \ast \mathrm{IDFT}\left\{e^{j2\pi\frac{d}{N}k}\right\}\\ \\ &= f[n] \ast \text{(a shifted sampled sinc() function with aliasing)} \\ \end{align*}$$

where $\ast$ denotes circular convolution.

The "shifted sampled sinc() function with aliasing" comes from taking the IDFT of a rectangularly windowed, frequency varying, exponential function.

The frequency varying exponential is the source of the shift.

The rectangular window (over the N points in the frequency domain), is the source of the sinc() function.

The limited time domain (N samples), trying to fit in the infinitely long sinc() function, manifests as aliasing.

The reason you don't notice this with shifts, $d$, that are an integer is that the sampled sinc() function looks like $[0, \dots, 0, 1, 0,\dots,0]$ for the case of an integer shift.

A "shifted sampled sinc() function with aliasing" is a horrible interpolation filter, as you may have noticed.

Update

The following Octave (Matlab clone) script demonstrates the results of this "IDFT interpolation" technique to interpolate the original signal at intersample increments of $0.1$ samples:

N = 10;
x = [0:N-1];
f = sin(x*2*pi/N);
F = fft(f, N);

D = 10;
d = [0:D-1]/D;

x2 = ones(D,1)*x + d.'*ones(1,N);
F2 = ones(D,1)*F .* exp(1i*2*pi*d.'*ones(1,N)/N.*(ones(D,1)*x));
f2 = ifft(F2, N, 2);

x3 = reshape(x2, 1, D*N);
f3 = reshape(f2, 1, D*N);

fideal = sin(x3*2*pi/N);
figure(1);
plot(x3, abs(f3), 'x-;IDFT Interp;', x3, abs(fideal), 'o-;Ideal Interp;');
title('Interpolated Signal Magnitude');
xlabel('Sample index (samples)');
ylabel('Magnitude');
grid on;

figure(2);
plot(x3, arg(f3), 'x-;IDFT Interp;', x3, arg(fideal), 'o-;Ideal Interp;');
title('Interpolated Signal Phase');
xlabel('Sample index (samples)');
ylabel('Phase (radians)');
grid on;

Here are the output magnitude and phase plots of the "IDFT interpolated" signal vs. the ideal interpolated signal:

enter image description here

enter image description here

At integer sample indices, the magnitude and phase of the two signals exactly match, so the DFT and IDFT are correct. No surprise there.

At non-integer sample indices, the phase indicates the signal is complex valued, and the magnitude can be just as wrong as it could possible be, such as the values at sample index 2.5.

The magnitude of the the incorrect signal might be something like a double frequency sine wave of the original sine wave, but I don't know for sure. That relationship might just be a special case that happens because of the parameters picked in this particular example.

Source Link
Andy Walls
  • 2.7k
  • 1
  • 10
  • 11

The inverse DFT is

$$f[n] = \dfrac{1}{N} \sum_{k=0}^{N-1} F[k] e^{j2\pi\frac{k}{N}n}$$

You were computing

$$\begin{align*}g[n+d] &= \dfrac{1}{N} \sum_{k=0}^{N-1} F[k] e^{j2\pi\frac{k}{N}(n+d)}\\ \\ &= \dfrac{1}{N} \sum_{k=0}^{N-1} \left(F[k]e^{j2\pi\frac{k}{N}d}\right) e^{j2\pi\frac{k}{N}n}\\ \\ &= \mathrm{IDFT}\left\{F[k]e^{j2\pi\frac{d}{N}k}\right\}\\ \\ &= \mathrm{IDFT}\left\{F[k]\right\} \ast \mathrm{IDFT}\left\{e^{j2\pi\frac{d}{N}k}\right\}\\ \\ &= f[n] \ast \text{(a shifted sampled sinc() function with aliasing)} \\ \end{align*}$$

where $\ast$ denotes circular convolution.

The "shifted sampled sinc() function with aliasing" comes from taking the IDFT of a rectangularly windowed, frequency varying, exponential function.

The frequency varying exponential is the source of the shift.

The rectangular window (over the N points in the frequency domain), is the source of the sinc() function.

The limited time domain (N samples), trying to fit in the infinitely long sinc() function, manifests as aliasing.

The reason you don't notice this with shifts, $d$, that are an integer is that the sampled sinc() function looks like $[0, \dots, 0, 1, 0,\dots,0]$ for the case of an integer shift.

A "shifted sampled sinc() function with aliasing" is a horrible interpolation filter, as you may have noticed.