added 26 characters in body
Source Link

f(x) = sin( x * PI / 5 )$$ f(x) = \sin \left( \tfrac{\pi}{5} x \right) $$

(1/10) * exp( 2 * PI * i * 1/10 ) * (0 - 5i) = (0.293893, -0.404508i)$$ \tfrac{1}{10} e^{i 2 \pi (1/10)} \cdot (0 - 5i) = (0.293893 -0.404508i) $$

(1/10) * exp( 2 * PI * i * 9/10 ) * (0 + 5i) = (0.293893, 0.404508i)$$ \tfrac{1}{10} e^{i 2 \pi (9/10)} \cdot (0 + 5i) = (0.293893 +0.404508i) $$

f(x) = sin( x * PI / 5 )

(1/10) * exp( 2 * PI * i * 1/10 ) * (0 - 5i) = (0.293893, -0.404508i)

(1/10) * exp( 2 * PI * i * 9/10 ) * (0 + 5i) = (0.293893, 0.404508i)

$$ f(x) = \sin \left( \tfrac{\pi}{5} x \right) $$

$$ \tfrac{1}{10} e^{i 2 \pi (1/10)} \cdot (0 - 5i) = (0.293893 -0.404508i) $$

$$ \tfrac{1}{10} e^{i 2 \pi (9/10)} \cdot (0 + 5i) = (0.293893 +0.404508i) $$

Tweeted twitter.com/StackSignals/status/1312089989761687552
added 17 characters in body
Source Link

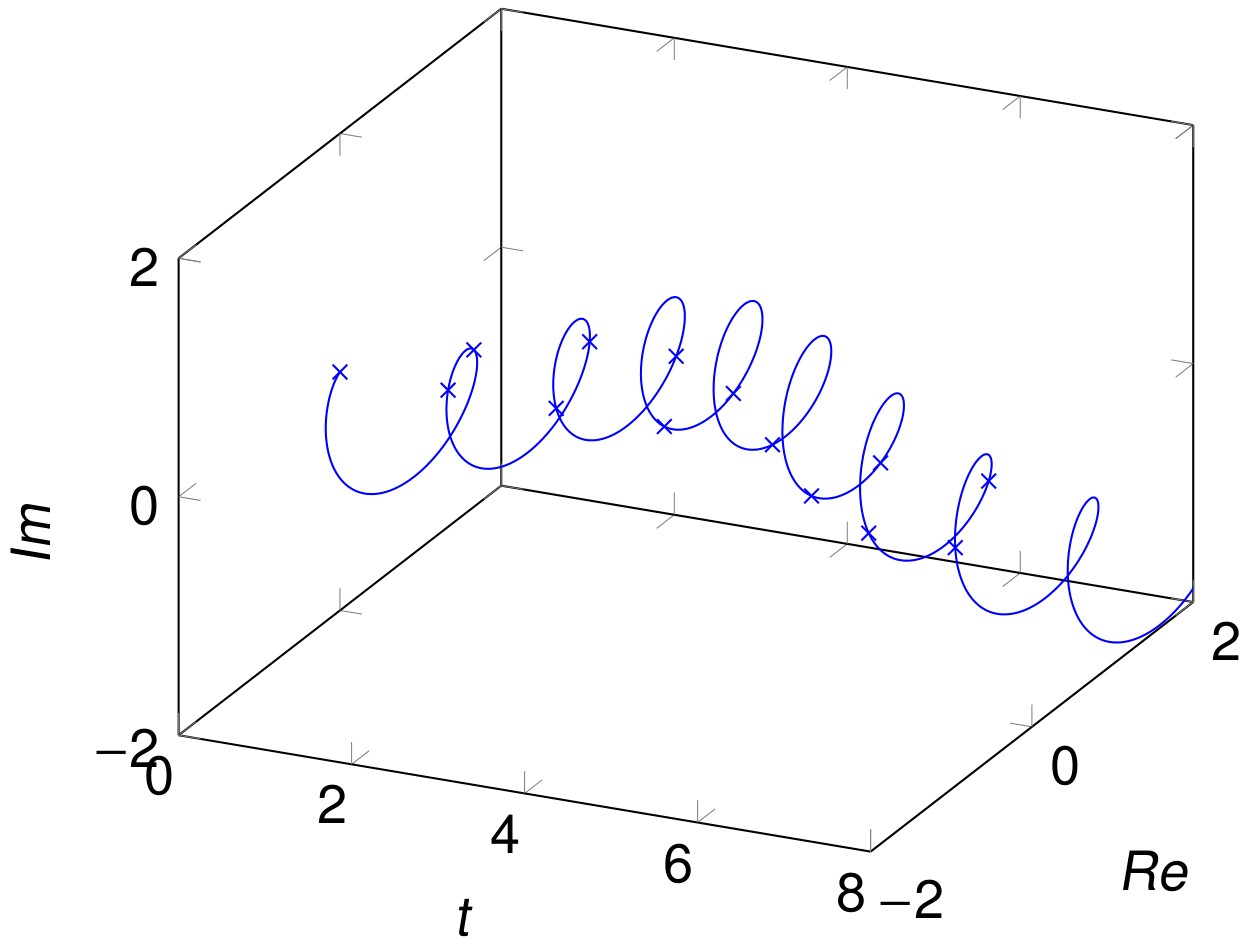
Great to have these expert answers here! I can contribute the 3D plot which supports my intuition and therefore might also be helpful for others. It shows Ff(t) computed by IDFT and how it travels over the original data points (crosses). In order to achieve this, it makes use of the whole space including the complex plane.

Great to have these expert answers here! I can contribute the 3D plot which supports my intuition and therefore might also be helpful for others. It shows F(t) and how it travels over the original data points (crosses). In order to achieve this, it makes use of the whole space including the complex plane.

Great to have these expert answers here! I can contribute the 3D plot which supports my intuition and therefore might also be helpful for others. It shows f(t) computed by IDFT and how it travels over the original data points (crosses). In order to achieve this, it makes use of the whole space including the complex plane.

added 392 characters in body
Source Link

EDIT2

Great to have these expert answers here! I can contribute the 3D plot which supports my intuition and therefore might also be helpful for others. It shows F(t) and how it travels over the original data points (crosses). In order to achieve this, it makes use of the whole space including the complex plane.

3D plot

added 5 characters in body
Source Link
Loading
added 1484 characters in body
Source Link
Loading
added 1484 characters in body
Source Link
Loading
Source Link
Loading