added 425 characters in body
Source Link
Saira
  • 104
  • 9

Not sure which platform you are using . if it's MATLAB , here is small code snippet which I quickly wrote using MATLAB's inbuilt "strfind" function

A = [12  534 5 23 44 66  23 68  86854  7  36 457 68 23 46 87 78 588 86 8 44 66  23 68  86854 87 9 905  0 -213 34];
B = [44 66  23 68  86854]

strfind(A,B)    % returns 5 and 21 (starting index of Array B)

You can always use cross-correlation to find the similarity between A and B

Please go through this post . It has detailed explanation with examples.

https://www.mathworks.com/help/signal/examples/measuring-signal-similarities.html

EDITED :

you can alternatively use xcorr function too

For the same example vectors A, B .. you can do something like this

xCorrResult = xcorr(B,A);
plot(xCorrResult)

enter image description here

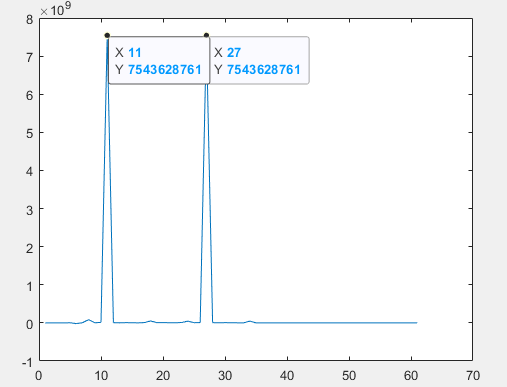
You can see two peaks at index 11 and 27 which indicates B vector lies in A at indexes 5 (11 - length(B) -1) and 21 (27 - length(B) - 1)

Not sure which platform you are using . if it's MATLAB , here is small code snippet which I quickly wrote using MATLAB's inbuilt "strfind" function

A = [12  534 5 23 44 66  23 68  86854  7  36 457 68 23 46 87 78 588 86 8 44 66  23 68  86854 87 9 905  0 -213 34];
B = [44 66  23 68  86854]

strfind(A,B)    % returns 5 and 21 (starting index of Array B)

You can always use cross-correlation to find the similarity between A and B

Please go through this post . It has detailed explanation with examples.

https://www.mathworks.com/help/signal/examples/measuring-signal-similarities.html

EDITED :

you can alternatively use xcorr function too

For the same example vectors A, B .. you can do something like this

xCorrResult = xcorr(B,A);
plot(xCorrResult)

enter image description here

You can see two peaks at index 11 and 27 which indicates B vector lies in A at indexes 5 (11 - length(B) -1) and 21 (27 - length(B) - 1)

Source Link
Saira
  • 104
  • 9

Not sure which platform you are using . if it's MATLAB , here is small code snippet which I quickly wrote using MATLAB's inbuilt "strfind" function

A = [12  534 5 23 44 66  23 68  86854  7  36 457 68 23 46 87 78 588 86 8 44 66  23 68  86854 87 9 905  0 -213 34];
B = [44 66  23 68  86854]

strfind(A,B)    % returns 5 and 21 (starting index of Array B)

You can always use cross-correlation to find the similarity between A and B

Please go through this post . It has detailed explanation with examples.

https://www.mathworks.com/help/signal/examples/measuring-signal-similarities.html