Deriving this for phase versus sample time $n$ including a constant frequency at the start and end results in the following formulas specific to DFT parameters with the resulting sinusoidal frequency ramp given as $\cos(\phi(n))$. Expressing in units of phase versus time ensures phase continuity at the transitions:
$\phi(n)=\begin{cases}\omega_1n,&n \le n_1\\ \omega_1 n+\frac{\Delta \omega}{\Delta n}\big(\frac{n^2+n_1^2}{2}-n_1n\big),&n_1<n<n_2\\\omega_2n+(\omega_1-\omega_2)n_2+\frac{\Delta \omega}{\Delta n}\big(\frac{n_2^2+n_1^2}{2}-n_1n_2\big),&n\ge n_2\end{cases}\tag{2}\\\\$
With the resulting frequency ramp as $cos(\phi(n)$), in the time interval $[n = 0,N-1]$
Where:
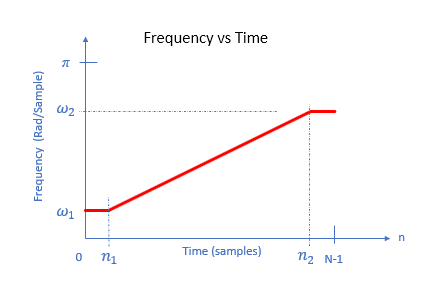
$n_1$ : index for start of ramp with frequency $\omega_1$ radians/sample
$n_2$ : index for end of ramp with frequency $\omega_2$ radians/sample
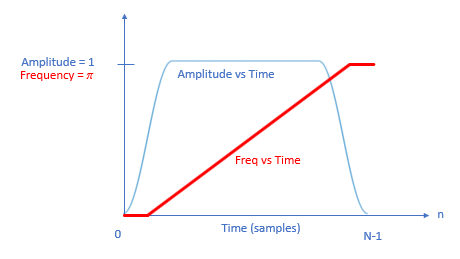
The parameters for the frequency ramp are further detailed in the graphic below:

Windowing Windowing will be important to minimize distortion in the DFT results. However given we are sweeping the input frequency with time, tapering the signal at the boundaries will reduce the signal levels at these test frequencies. An excellent window choice for this application is the Tukey window as we can selectively taper just the outer edges, while the majority of the window is flat, offering significant performance in frequency even with a relatively small $\alpha$ which is the ratio of the taper portion of the window to the flat portion. Additionally with a low $\alpha$ the resolution bandwidth is minimally impacted.


