added 3290 characters in body
Source Link
Cedron Dawg
  • 7.6k
  • 2
  • 9
  • 24

Progress Report: The code is posted, I'm done with this for a while.

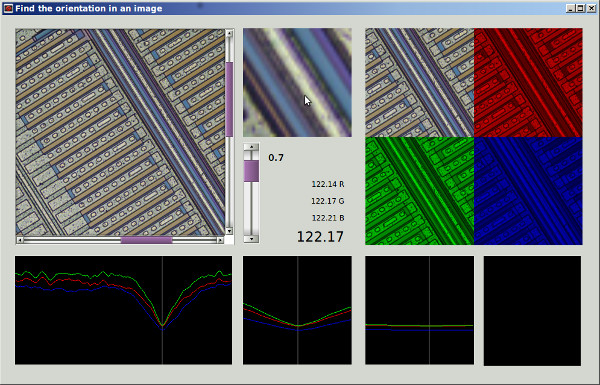
This screenshot is the program working on Marcus' 45 degree shot.

enter image description here

The color channels are processed independently.

A point is selected as the sweep center.

A diameter is swept through 180 degrees at discrete angles

At each angle, "volatility" is measuring across the diameter. A trace is made for each channel gathering samples. The sample value is a linear interpolation of the four corner values of whichever grid square the sample spot lands on.

For each channel trace

The samples are multiplied by a VonHann window function

A Smooth/Differ pass is made on the samples

The RMS of the Differ is used as a volatility measure

The lower row graphs are:

First is the sweep of 0 to 180 degrees, each pixel is 0.5 degrees. Second is the sweep around the selected angle, each pixel is 0.1 degrees. Third is the sweep around the selected angle, each pixel is 0.01 degrees. Fourth is the trace Differ curve

The initial selection is the minimal average volatility of the three channels. This will be close, but usually not on, the best angle. The symmetry at the trough is a better indicator than the minimum. A best fit parabola in that neighborhood should yield a very good answer.

The source code (in Gambas, PPA gambas-team/gambas3) can be found at:

https://forum.gambas.one/viewtopic.php?f=4&t=707

It is an ordinary zip file, so you don't have to install Gambas to look at the source. The files are in the ".src" subdirectory.

Removing the VonHann window yields higher accuracy because it effectively lengthens the trace, but adds wobbles. Perhaps a double VonHann would be better as the center is unimportant and a quicker onset of "when the teeter-totter hits the ground" will be detected. Accuracy can easily be improved my increasing the trace length as far as the image allows (Yes, that's automatible). A better window function, sinc?

The measures I have taken at the current settings confirm the 3.19 value +/-.03 ish.

This is just the measuring tool. There are several strategies I can think of to apply it to the image. That, as they say, is an exercise for the reader. Or in this case, the OP. I'll be trying my own later.

There's head room for improvement in both the algorithm and the program, but already they are really useful.

Here is how the linear interpolation works


'---- Whole Number Portion
            
        x = Floor(rx)
        y = Floor(ry)
        
'---- Fractional Portions
            
        fx = rx - x
        fy = ry - y
            
        gx = 1.0 - fx
        gy = 1.0 - fy
            
'---- Weighted Average

        vtl = ArgValues[x, y] * gx * gy         ' Top Left
        vtr = ArgValues[x + 1, y] * fx * gy     ' Top Right
        vbl = ArgValues[x, y + 1] * gx * fy     ' Bottom Left
        vbr = ArgValues[x + 1, y + 1] * fx * fy ' Bottom Rigth
        
        v = vtl + vtr + vbl + vbr

Anybody know the conventional name for that?
added 549 characters in body
Source Link
Cedron Dawg
  • 7.6k
  • 2
  • 9
  • 24

There is a similar DSP trick here, but I don't remember the details exactly.

I read about it somewhere, some while ago. It has to do with figuring out fabric pattern matches regardless of the orientation. So you may want to research on that.

Grab a circle sample. Do sums along spokes of the circle to get a circumference profile. Then they did a DFT on that (it is inherently circular after all). Toss the phase information (make it orientation independent) and make a comparison.

Then they could tell whether two fabrics had the same pattern.

Your problem is similar.

It seems to me, without trying it first, that the characteristics of the pre DFT profile should reveal the orientation. Doing standard deviations along the spokes instead of sums should work better, maybe both.

Now, if you had an oriented reference image, you could use their technique.

Ced


Your precision requirements are rather strict.

I gave this a whack. Taking the sum of the absolute values of the differences between two subsequent points along the spoke for each color.

Here is a graph of around the circumference. Your value is plotted with the white markers.

enter image description here

You can sort of see it, but I don't think this is going to work for you. Sorry.


Progress Report: Some

I've decided on a three step process.

  1. Find evaluation spot.

  2. Coarse Measurement

  3. Fine Measurement

Currently, the first step is user intevention. It should be automatible, but I'm not bothering. I have a rough draft of the second step. There's some tweaking I want to try. Finally, I have a few candidates for the third step that is going to take testing to see which works best.

The good news is it is lighting fast. If your only purposed is to make an image look level on a web page, then your tolerances are way too strict and the coarse measurement ought to be accurate enough.

This is the coarse measurement. Each pixel is about 0.6 degrees. (Edit, actually 0.3)

enter image description here


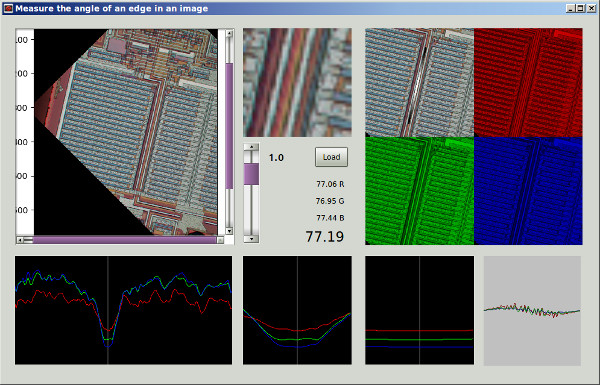
Progress Report: Able to get good results

enter image description here

Most aren't this good, but they are cheap (and fairly local) and finding spots to get good reads is easy..... for a human. Brute force should work fine for a program.

The results can be much improved on, this is a simple baseline test. I'm not ready to do any explaining yet, nor post the code, but this screen shot ain't photoshopped.

There is a similar DSP trick here, but I don't remember the details exactly.

I read about it somewhere, some while ago. It has to do with figuring out fabric pattern matches regardless of the orientation. So you may want to research on that.

Grab a circle sample. Do sums along spokes of the circle to get a circumference profile. Then they did a DFT on that (it is inherently circular after all). Toss the phase information (make it orientation independent) and make a comparison.

Then they could tell whether two fabrics had the same pattern.

Your problem is similar.

It seems to me, without trying it first, that the characteristics of the pre DFT profile should reveal the orientation. Doing standard deviations along the spokes instead of sums should work better, maybe both.

Now, if you had an oriented reference image, you could use their technique.

Ced


Your precision requirements are rather strict.

I gave this a whack. Taking the sum of the absolute values of the differences between two subsequent points along the spoke for each color.

Here is a graph of around the circumference. Your value is plotted with the white markers.

enter image description here

You can sort of see it, but I don't think this is going to work for you. Sorry.


Progress Report: Some

I've decided on a three step process.

  1. Find evaluation spot.

  2. Coarse Measurement

  3. Fine Measurement

Currently, the first step is user intevention. It should be automatible, but I'm not bothering. I have a rough draft of the second step. There's some tweaking I want to try. Finally, I have a few candidates for the third step that is going to take testing to see which works best.

The good news is it is lighting fast. If your only purposed is to make an image look level on a web page, then your tolerances are way too strict and the coarse measurement ought to be accurate enough.

This is the coarse measurement. Each pixel is about 0.6 degrees.

enter image description here

There is a similar DSP trick here, but I don't remember the details exactly.

I read about it somewhere, some while ago. It has to do with figuring out fabric pattern matches regardless of the orientation. So you may want to research on that.

Grab a circle sample. Do sums along spokes of the circle to get a circumference profile. Then they did a DFT on that (it is inherently circular after all). Toss the phase information (make it orientation independent) and make a comparison.

Then they could tell whether two fabrics had the same pattern.

Your problem is similar.

It seems to me, without trying it first, that the characteristics of the pre DFT profile should reveal the orientation. Doing standard deviations along the spokes instead of sums should work better, maybe both.

Now, if you had an oriented reference image, you could use their technique.

Ced


Your precision requirements are rather strict.

I gave this a whack. Taking the sum of the absolute values of the differences between two subsequent points along the spoke for each color.

Here is a graph of around the circumference. Your value is plotted with the white markers.

enter image description here

You can sort of see it, but I don't think this is going to work for you. Sorry.


Progress Report: Some

I've decided on a three step process.

  1. Find evaluation spot.

  2. Coarse Measurement

  3. Fine Measurement

Currently, the first step is user intevention. It should be automatible, but I'm not bothering. I have a rough draft of the second step. There's some tweaking I want to try. Finally, I have a few candidates for the third step that is going to take testing to see which works best.

The good news is it is lighting fast. If your only purposed is to make an image look level on a web page, then your tolerances are way too strict and the coarse measurement ought to be accurate enough.

This is the coarse measurement. Each pixel is about 0.6 degrees. (Edit, actually 0.3)

enter image description here


Progress Report: Able to get good results

enter image description here

Most aren't this good, but they are cheap (and fairly local) and finding spots to get good reads is easy..... for a human. Brute force should work fine for a program.

The results can be much improved on, this is a simple baseline test. I'm not ready to do any explaining yet, nor post the code, but this screen shot ain't photoshopped.

added 824 characters in body
Source Link
Cedron Dawg
  • 7.6k
  • 2
  • 9
  • 24

There is a similar DSP trick here, but I don't remember the details exactly.

I read about it somewhere, some while ago. It has to do with figuring out fabric pattern matches regardless of the orientation. So you may want to research on that.

Grab a circle sample. Do sums along spokes of the circle to get a circumference profile. Then they did a DFT on that (it is inherently circular after all). Toss the phase information (make it orientation independent) and make a comparison.

Then they could tell whether two fabrics had the same pattern.

Your problem is similar.

It seems to me, without trying it first, that the characteristics of the pre DFT profile should reveal the orientation. Doing standard deviations along the spokes instead of sums should work better, maybe both.

Now, if you had an oriented reference image, you could use their technique.

Ced


Your precision requirements are rather strict.

I gave this a whack. Taking the sum of the absolute values of the differences between two subsequent points along the spoke for each color.

Here is a graph of around the circumference. Your value is plotted with the white markers.

enter image description here

You can sort of see it, but I don't think this is going to work for you. Sorry.


Progress Report: Some

I've decided on a three step process.

  1. Find evaluation spot.

  2. Coarse Measurement

  3. Fine Measurement

Currently, the first step is user intevention. It should be automatible, but I'm not bothering. I have a rough draft of the second step. There's some tweaking I want to try. Finally, I have a few candidates for the third step that is going to take testing to see which works best.

The good news is it is lighting fast. If your only purposed is to make an image look level on a web page, then your tolerances are way too strict and the coarse measurement ought to be accurate enough.

This is the coarse measurement. Each pixel is about 0.6 degrees.

enter image description here

There is a similar DSP trick here, but I don't remember the details exactly.

I read about it somewhere, some while ago. It has to do with figuring out fabric pattern matches regardless of the orientation. So you may want to research on that.

Grab a circle sample. Do sums along spokes of the circle to get a circumference profile. Then they did a DFT on that (it is inherently circular after all). Toss the phase information (make it orientation independent) and make a comparison.

Then they could tell whether two fabrics had the same pattern.

Your problem is similar.

It seems to me, without trying it first, that the characteristics of the pre DFT profile should reveal the orientation. Doing standard deviations along the spokes instead of sums should work better, maybe both.

Now, if you had an oriented reference image, you could use their technique.

Ced


Your precision requirements are rather strict.

I gave this a whack. Taking the sum of the absolute values of the differences between two subsequent points along the spoke for each color.

Here is a graph of around the circumference. Your value is plotted with the white markers.

enter image description here

You can sort of see it, but I don't think this is going to work for you. Sorry.


Progress Report: Some

I've decided on a three step process.

  1. Find evaluation spot.

  2. Coarse Measurement

  3. Fine Measurement

Currently, the first step is user intevention. It should be automatible, but I'm not bothering. I have a rough draft of the second step. There's some tweaking I want to try. Finally, I have a few candidates for the third step that is going to take testing to see which works best.

The good news is it is lighting fast. If your only purposed is to make an image look level on a web page, then your tolerances are way too strict and the coarse measurement ought to be accurate enough.

This is the coarse measurement. Each pixel is about 0.6 degrees.

enter image description here

added 501 characters in body
Source Link
Cedron Dawg
  • 7.6k
  • 2
  • 9
  • 24
Loading
Source Link
Cedron Dawg
  • 7.6k
  • 2
  • 9
  • 24
Loading