Bumped by Community user
Fixing spelling and formatting.
Source Link
Peter K.
  • 26k
  • 9
  • 47
  • 93

I need to model a noise whitwith a givegiven PSD. To do this, I am starting from a white gaussian noise (WGN) and feed with the wgnWGN a trasfer funtiontransfer function, which will act like a filter. Infact it'sIn fact,it's easy to prove that if you choose a PSD of the white noise equal to $1 unit^2/(Hz)$$1 {\rm unit}^2/{\rm Hz}$,then the output is $ H(f)*1$$ H(f) \times 1$. Thus $$ PSD =|H(f)|^2 $$

Gain in the transfer function actacts properly, translating the PSD up or down. The problemisproblem is with the zeros and poles. No matter how I create the tftransfer function (1st, 2nd, or majorhigher order), the PSD will be flat in the region of interest $f_{range} = [10^{-6}, 10] Hz $$f_{\rm range} = [10^{-6}, 10] {\rm Hz} $

The transfer function is $$ H = \frac{10^{-11}(s+2*10^{-3})^2}{(s+10^{-9})^2}; $$$$ H = \frac{10^{-11}(s+2 \times 10^{-3})^2}{(s+10^{-9})^2}; $$

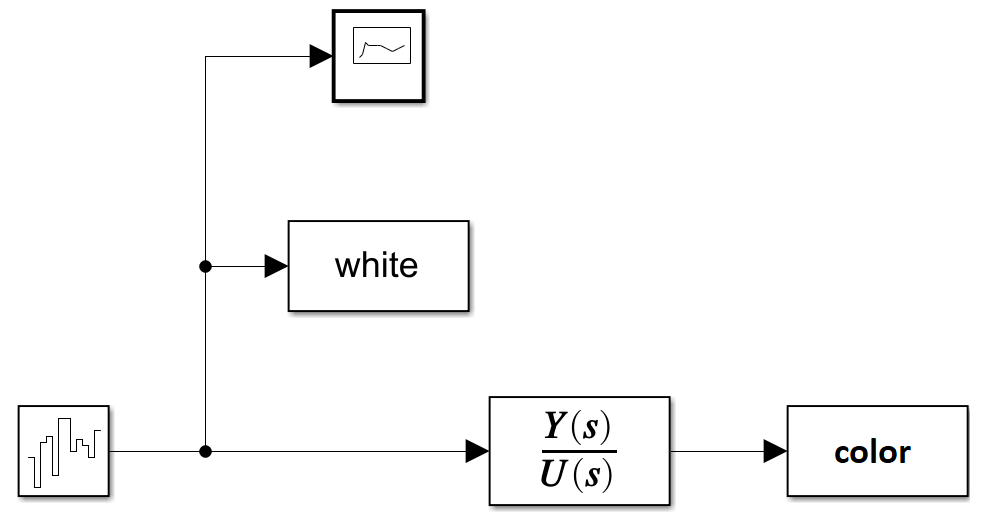
It is easy to build in Simulink a band limited white noise whitwith PSD = 1 (choosing sample and power).

enter image description here

Evaluate then the output of the tfTF in matlab with this

%% PSD estimation
for i =[1e-8 1e-7 1e-6 1e-5, 1e-4, 1e-3, 1e-2 1e-1 1]
    f_range = linspace(i,i*10,1000);
    
    [pxx_white] = pwelch(white,[],[],f_range);

    [pxx_color] = pwelch(color,[],[],f_range);

    
    loglog(f_range,sqrt(pxx_white./(2*pi)),'k')
    hold on
    loglog(f_range,sqrt(pxx_color./(2*pi)),'r')

end

xlabel('Frequency (Hz)')
ylabel('RPSD (unit/Hz^(1/2))')
legend('white','color')
grid on

Now my question is: Am I doing something theoretically wrong? Maybe I can't reach PSD in the low frequency region due to the simulation time? I simulate for 10000 s (1e-4 Hz).

in

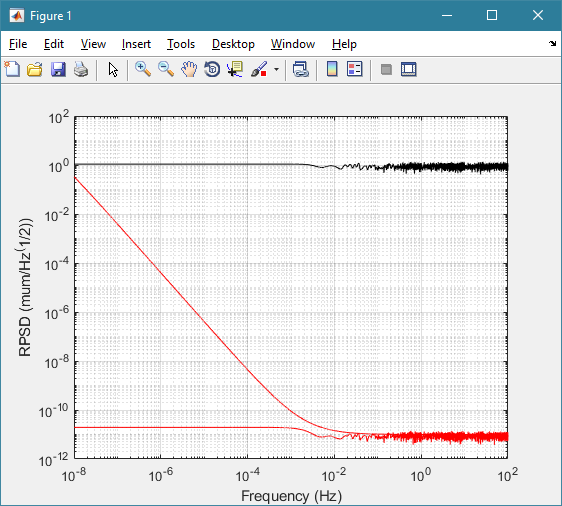
In black: white noise PSD, in red: flat the colored noise PSD, the curve is the plot of the tf.

I need to model a noise whit a give PSD. To do this, I am starting from a white gaussian noise and feed with the wgn a trasfer funtion, which will act like a filter. Infact it's easy to prove that if you choose a PSD of the white noise equal to $1 unit^2/(Hz)$,then the output is $ H(f)*1$. Thus $$ PSD =|H(f)|^2 $$

Gain in the transfer function act properly, translating the PSD up or down. The problemis with the zeros and poles. No matter how I create the tf (1st 2nd or major order), the PSD will be flat in the region of interest $f_{range} = [10^{-6}, 10] Hz $

The transfer function is $$ H = \frac{10^{-11}(s+2*10^{-3})^2}{(s+10^{-9})^2}; $$

It is easy to build in Simulink a band limited white noise whit PSD = 1 (choosing sample and power).

enter image description here

Evaluate then the output of the tf in matlab with this

%% PSD estimation
for i =[1e-8 1e-7 1e-6 1e-5, 1e-4, 1e-3, 1e-2 1e-1 1]
    f_range = linspace(i,i*10,1000);
    
    [pxx_white] = pwelch(white,[],[],f_range);

    [pxx_color] = pwelch(color,[],[],f_range);

    
    loglog(f_range,sqrt(pxx_white./(2*pi)),'k')
    hold on
    loglog(f_range,sqrt(pxx_color./(2*pi)),'r')

end

xlabel('Frequency (Hz)')
ylabel('RPSD (unit/Hz^(1/2))')
legend('white','color')
grid on

Now my question is: Am I doing something theoretically wrong? Maybe I can't reach PSD in the low frequency region due to the simulation time? I simulate for 10000 s (1e-4 Hz).

in black white noise PSD, in red flat the colored noise PSD, the curve is the plot of the tf

I need to model a noise with a given PSD. To do this, I am starting from a white gaussian noise (WGN) and feed with the WGN a transfer function, which will act like a filter. In fact,it's easy to prove that if you choose a PSD of the white noise equal to $1 {\rm unit}^2/{\rm Hz}$,then the output is $ H(f) \times 1$. Thus $$ PSD =|H(f)|^2 $$

Gain in the transfer function acts properly, translating the PSD up or down. The problem is with the zeros and poles. No matter how I create the transfer function (1st, 2nd, or higher order), the PSD will be flat in the region of interest $f_{\rm range} = [10^{-6}, 10] {\rm Hz} $

The transfer function is $$ H = \frac{10^{-11}(s+2 \times 10^{-3})^2}{(s+10^{-9})^2}; $$

It is easy to build in Simulink band limited white noise with PSD = 1 (choosing sample and power).

enter image description here

Evaluate then the output of the TF in matlab with this

%% PSD estimation
for i =[1e-8 1e-7 1e-6 1e-5, 1e-4, 1e-3, 1e-2 1e-1 1]
    f_range = linspace(i,i*10,1000);
    
    [pxx_white] = pwelch(white,[],[],f_range);

    [pxx_color] = pwelch(color,[],[],f_range);

    
    loglog(f_range,sqrt(pxx_white./(2*pi)),'k')
    hold on
    loglog(f_range,sqrt(pxx_color./(2*pi)),'r')

end

xlabel('Frequency (Hz)')
ylabel('RPSD (unit/Hz^(1/2))')
legend('white','color')
grid on

Now my question is: Am I doing something theoretically wrong? Maybe I can't reach PSD in the low frequency region due to the simulation time? I simulate for 10000 s (1e-4 Hz).

In black: white noise PSD, in red: flat the colored noise PSD, the curve is the plot of the tf.

deleted 6 characters in body
Source Link
Ba5o
  • 61
  • 3

I need to model a noise whit a give PSD. To do this, I am starting from a white gaussian nois N(0,1)noise and feed with the wgn a trasfer funtion, which will act like a filter. Infact it's easy to prove that if you choose a PSD of the white noise equal to $1 unit^2/(Hz)$,then the output is $ H(f)*1$. Thus $$ PSD =|H(f)|^2 $$

Gain in the transfer function act properly, translating the PSD up or down. The problemis with the zeros and poles. No matter how I create the tf (1st 2nd or major order), the PSD will be flat in the region of interest $f_{range} = [10^{-6}, 10] Hz $

The transfer function is $$ H = \frac{10^{-11}(s+2*10^{-3})^2}{(s+10^{-9})^2}; $$

It is easy to build in Simulink a band limited white noise whit PSD = 1 (choosing sample and power).

enter image description here

Evaluate then the output of the tf in matlab with this

%% PSD estimation
for i =[1e-8 1e-7 1e-6 1e-5, 1e-4, 1e-3, 1e-2 1e-1 1]
    f_range = linspace(i,i*10,1000);
    
    [pxx_white] = pwelch(white,[],[],f_range);

    [pxx_color] = pwelch(color,[],[],f_range);

    
    loglog(f_range,sqrt(pxx_white./(2*pi)),'k')
    hold on
    loglog(f_range,sqrt(pxx_color./(2*pi)),'r')

end

xlabel('Frequency (Hz)')
ylabel('RPSD (unit/Hz^(1/2))')
legend('white','color')
grid on

Now my question is: Am I doing something theoretically wrong? Maybe I can't reach PSD in the low frequency region due to the simulation time? I simulate for 10000 s (1e-4 Hz).

in black white noise PSD, in red flat the colored noise PSD, the curve is the plot of the tf

I need to model a noise whit a give PSD. To do this, I am starting from a white gaussian nois N(0,1) and feed with the wgn a trasfer funtion, which will act like a filter. Infact it's easy to prove that if you choose a PSD of the white noise equal to $1 unit^2/(Hz)$,then the output is $ H(f)*1$. Thus $$ PSD =|H(f)|^2 $$

Gain in the transfer function act properly, translating the PSD up or down. The problemis with the zeros and poles. No matter how I create the tf (1st 2nd or major order), the PSD will be flat in the region of interest $f_{range} = [10^{-6}, 10] Hz $

The transfer function is $$ H = \frac{10^{-11}(s+2*10^{-3})^2}{(s+10^{-9})^2}; $$

It is easy to build in Simulink a band limited white noise whit PSD = 1 (choosing sample and power).

enter image description here

Evaluate then the output of the tf in matlab with this

%% PSD estimation
for i =[1e-8 1e-7 1e-6 1e-5, 1e-4, 1e-3, 1e-2 1e-1 1]
    f_range = linspace(i,i*10,1000);
    
    [pxx_white] = pwelch(white,[],[],f_range);

    [pxx_color] = pwelch(color,[],[],f_range);

    
    loglog(f_range,sqrt(pxx_white./(2*pi)),'k')
    hold on
    loglog(f_range,sqrt(pxx_color./(2*pi)),'r')

end

xlabel('Frequency (Hz)')
ylabel('RPSD (unit/Hz^(1/2))')
legend('white','color')
grid on

Now my question is: Am I doing something theoretically wrong? Maybe I can't reach PSD in the low frequency region due to the simulation time? I simulate for 10000 s (1e-4 Hz).

in black white noise PSD, in red flat the colored noise PSD, the curve is the plot of the tf

I need to model a noise whit a give PSD. To do this, I am starting from a white gaussian noise and feed with the wgn a trasfer funtion, which will act like a filter. Infact it's easy to prove that if you choose a PSD of the white noise equal to $1 unit^2/(Hz)$,then the output is $ H(f)*1$. Thus $$ PSD =|H(f)|^2 $$

Gain in the transfer function act properly, translating the PSD up or down. The problemis with the zeros and poles. No matter how I create the tf (1st 2nd or major order), the PSD will be flat in the region of interest $f_{range} = [10^{-6}, 10] Hz $

The transfer function is $$ H = \frac{10^{-11}(s+2*10^{-3})^2}{(s+10^{-9})^2}; $$

It is easy to build in Simulink a band limited white noise whit PSD = 1 (choosing sample and power).

enter image description here

Evaluate then the output of the tf in matlab with this

%% PSD estimation
for i =[1e-8 1e-7 1e-6 1e-5, 1e-4, 1e-3, 1e-2 1e-1 1]
    f_range = linspace(i,i*10,1000);
    
    [pxx_white] = pwelch(white,[],[],f_range);

    [pxx_color] = pwelch(color,[],[],f_range);

    
    loglog(f_range,sqrt(pxx_white./(2*pi)),'k')
    hold on
    loglog(f_range,sqrt(pxx_color./(2*pi)),'r')

end

xlabel('Frequency (Hz)')
ylabel('RPSD (unit/Hz^(1/2))')
legend('white','color')
grid on

Now my question is: Am I doing something theoretically wrong? Maybe I can't reach PSD in the low frequency region due to the simulation time? I simulate for 10000 s (1e-4 Hz).

in black white noise PSD, in red flat the colored noise PSD, the curve is the plot of the tf

Source Link
Ba5o
  • 61
  • 3

Why I don't get the right PSD

I need to model a noise whit a give PSD. To do this, I am starting from a white gaussian nois N(0,1) and feed with the wgn a trasfer funtion, which will act like a filter. Infact it's easy to prove that if you choose a PSD of the white noise equal to $1 unit^2/(Hz)$,then the output is $ H(f)*1$. Thus $$ PSD =|H(f)|^2 $$

Gain in the transfer function act properly, translating the PSD up or down. The problemis with the zeros and poles. No matter how I create the tf (1st 2nd or major order), the PSD will be flat in the region of interest $f_{range} = [10^{-6}, 10] Hz $

The transfer function is $$ H = \frac{10^{-11}(s+2*10^{-3})^2}{(s+10^{-9})^2}; $$

It is easy to build in Simulink a band limited white noise whit PSD = 1 (choosing sample and power).

enter image description here

Evaluate then the output of the tf in matlab with this

%% PSD estimation
for i =[1e-8 1e-7 1e-6 1e-5, 1e-4, 1e-3, 1e-2 1e-1 1]
    f_range = linspace(i,i*10,1000);
    
    [pxx_white] = pwelch(white,[],[],f_range);

    [pxx_color] = pwelch(color,[],[],f_range);

    
    loglog(f_range,sqrt(pxx_white./(2*pi)),'k')
    hold on
    loglog(f_range,sqrt(pxx_color./(2*pi)),'r')

end

xlabel('Frequency (Hz)')
ylabel('RPSD (unit/Hz^(1/2))')
legend('white','color')
grid on

Now my question is: Am I doing something theoretically wrong? Maybe I can't reach PSD in the low frequency region due to the simulation time? I simulate for 10000 s (1e-4 Hz).

in black white noise PSD, in red flat the colored noise PSD, the curve is the plot of the tf