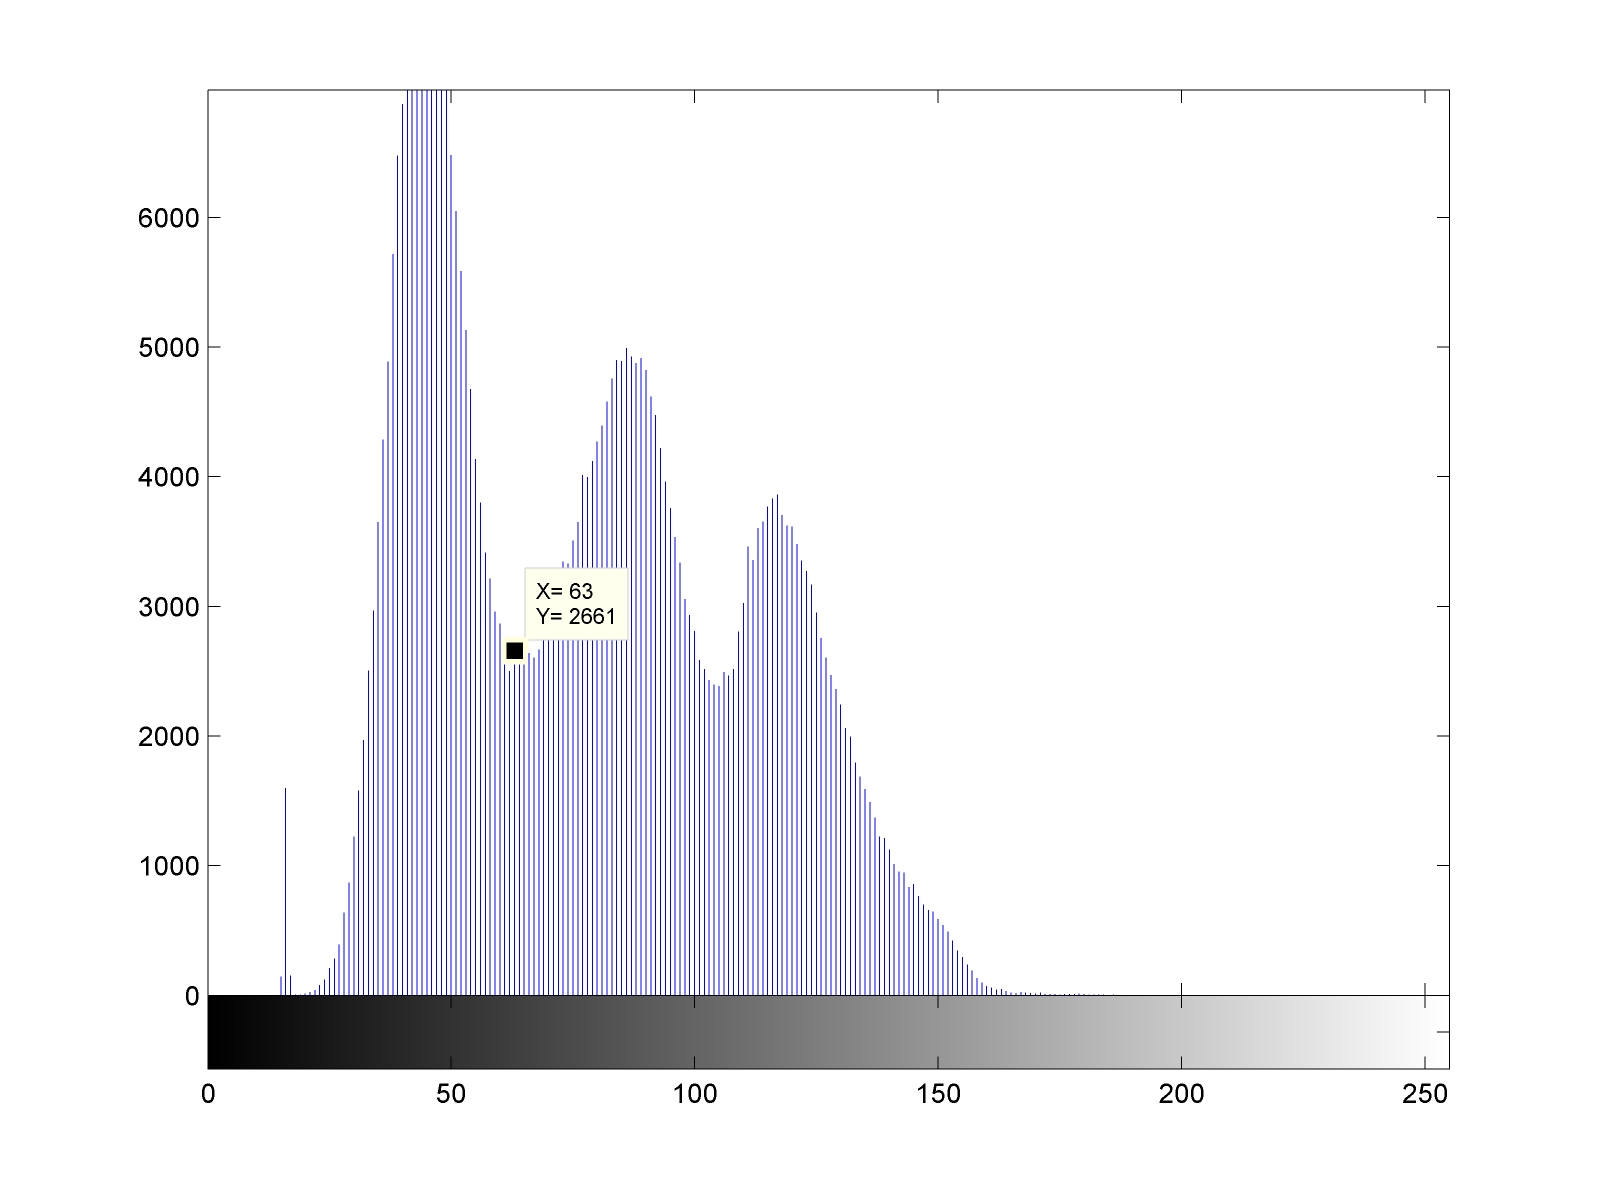
I think that you gave up on threshold techniques too early. Take a look at your histogram, it is clearly tri-modal:
(I removed the white columns to the right of your image manually, I assume that they are not part of the image - please take this image before running my code)

Take a look at all values in the first group:

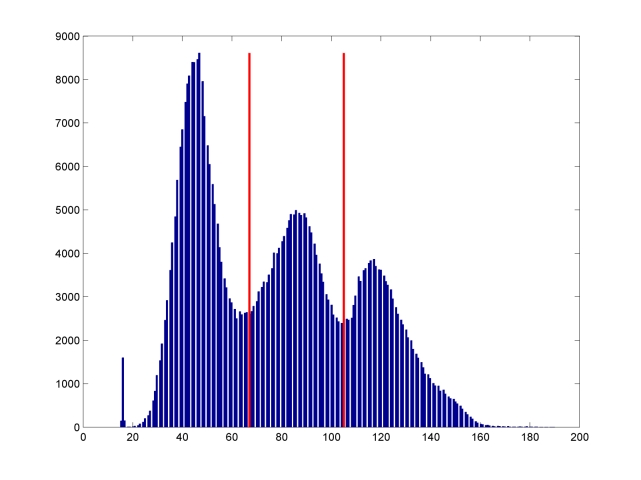
In order to find modes in tri-modal histogram, it is possible to use K-means clustering with K=3K=3 on intensity. The following Matlab code finds th1=67 on your code. The idea is to assume that you have the 3 sets, and calculate the weighted centroid on each one. Then, each intensity level is assigned to its own cluster. You stop when the weighted centroids cease moving. Here is the result of finding two thresholds on your image, shown on the histogram.

function [th1,th2]=SegmentHistTo3()
    im = imread('C:\star.png');
    h = imhist(im(:,:,1));
    th1new = round(256/3);
    th2new = round(256*2/3);
    th1 = 0;
    th2 = 0;
    while (th1~=th1new) || (th2~=th2new)
        th1 = th1new;
        th2 = th2new;

        wa1 = WeightedAverage(h,1,th1);
        wa2 = WeightedAverage(h,th1+1,th2);
        wa3 = WeightedAverage(h,th2,numel(h));

        th1new = round( (wa1+wa2)/2 );
        th2new = round( (wa2+wa3)/2 );
    end
    figure;imshow( im(:,:,1)<th1);
end

function wa = WeightedAverage(region,th1,th2)
    regionNonEmpty(th1:th2) = region(th1:th2);
    wa = sum( regionNonEmpty .* (1:numel(regionNonEmpty))) / sum(regionNonEmpty);
end
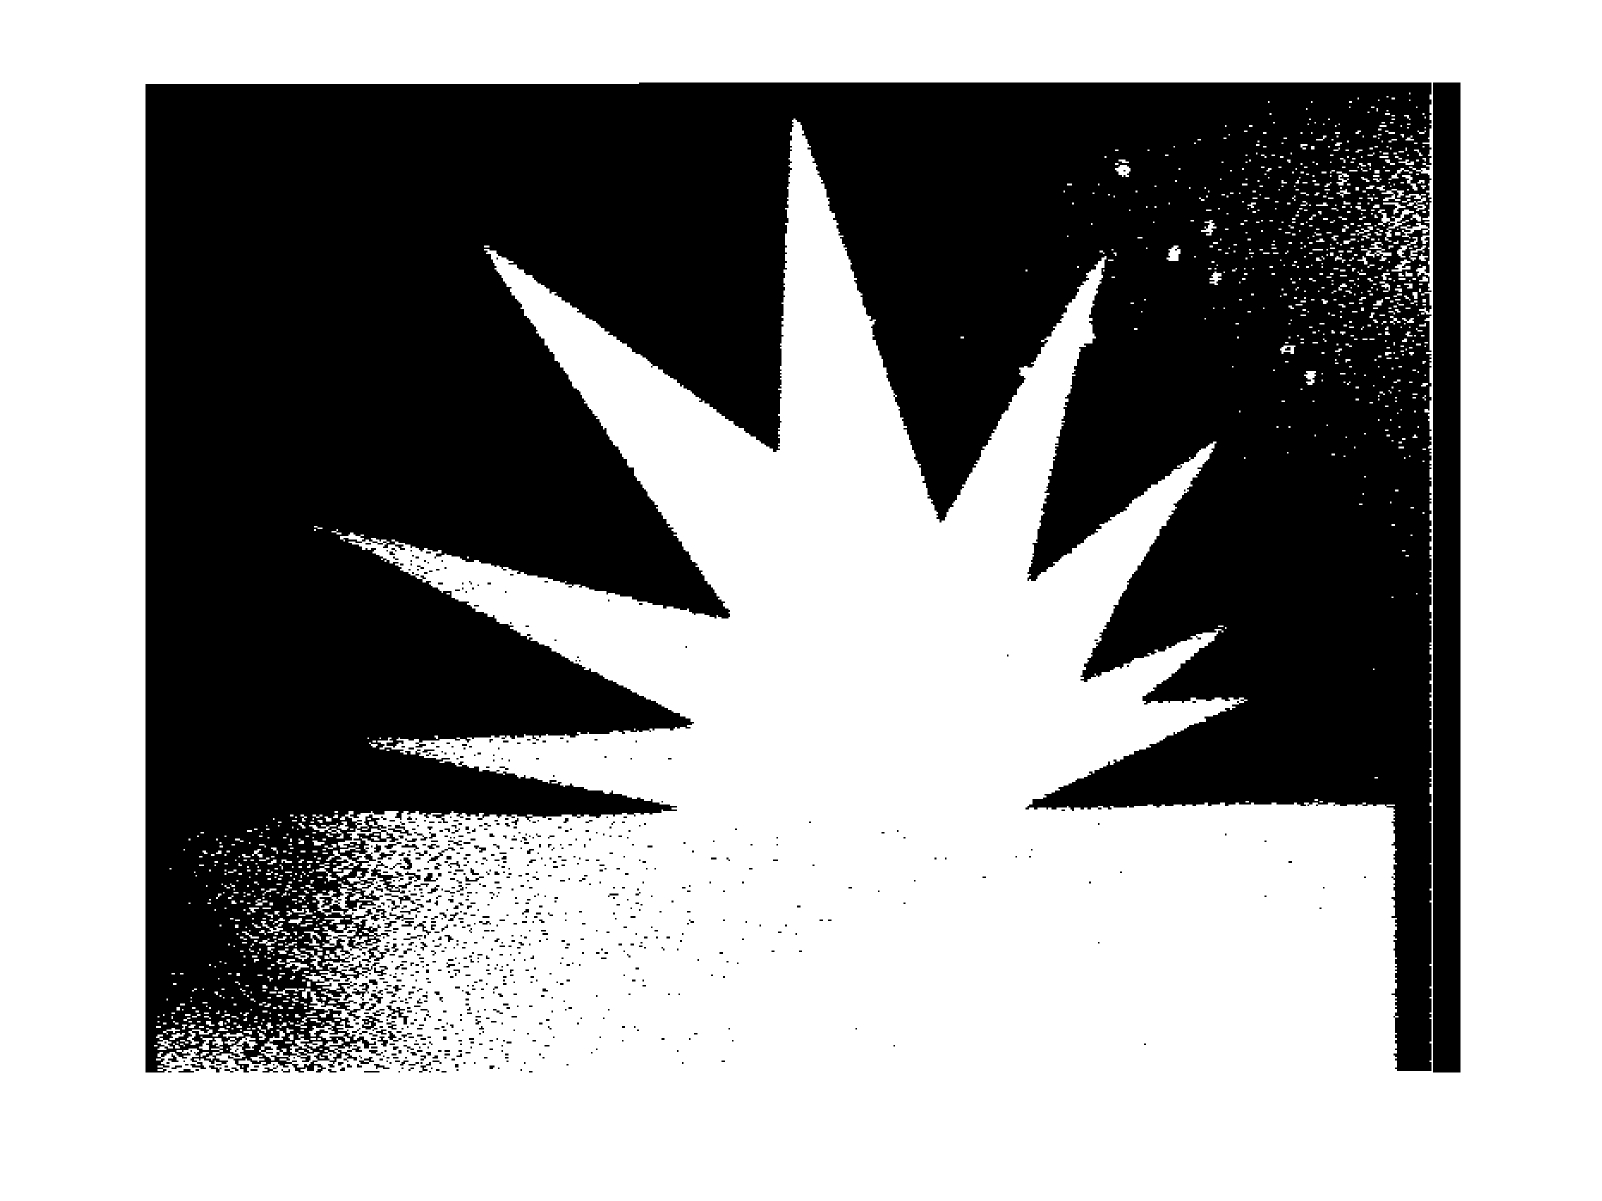
Solving the problem afterwards is a piece of cake, simply do some simple morphological operations, like opening:.


