added 10 characters in body; edited tags
Source Link
lennon310
  • 3.6k
  • 19
  • 25
  • 27

I don't unstand the nature of the output in Matlab's "butter" command. Calling

[b,a] = butter(4, 0.5, 'low');

gives me two vectors, which the documentation says are bb for numerator, and aa for denominator, of the transfer function.

However plotting the frequency response of this transfer function with freqz()freqz() does not give me what I expected.

If I plot

freqz(b./a)

I see:
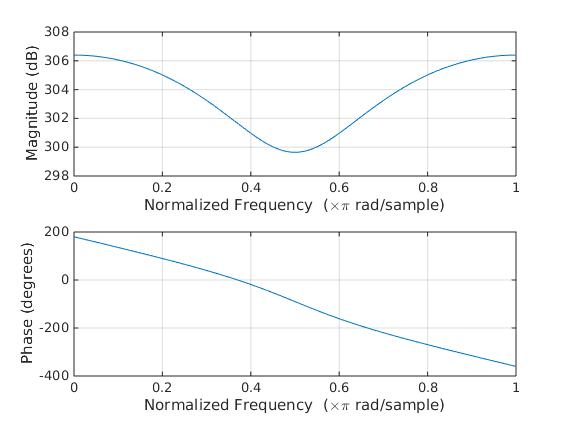
freqz of b over a

This is not a low pass filter, this is some sort of band stop filter suppressing the middle frequencies. However if I plot

freqz(b)

I see what looks like the low pass filter I was hoping for:
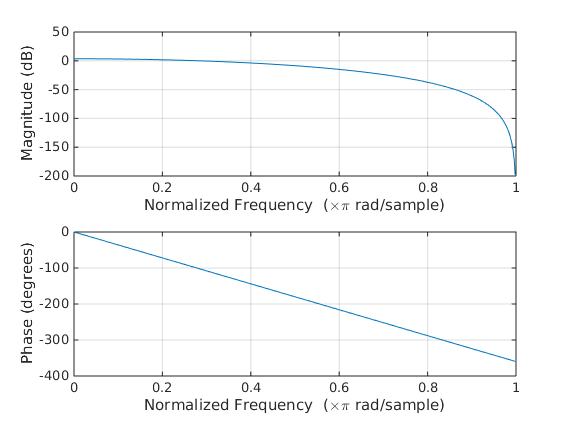
freqz of b only

So if I want to use a Butterworth filter to low pass my data, do I only use bb? And if so what is the point of aa?

I don't unstand the nature of the output in Matlab's "butter" command. Calling

[b,a] = butter(4, 0.5, 'low');

gives me two vectors, which the documentation says are b for numerator, and a for denominator, of the transfer function.

However plotting the frequency response of this transfer function with freqz() does not give me what I expected.

If I plot

freqz(b./a)

I see:

freqz of b over a

This is not a low pass filter, this is some sort of band stop filter suppressing the middle frequencies. However if I plot

freqz(b)

I see what looks like the low pass filter I was hoping for:

freqz of b only

So if I want to use a Butterworth filter to low pass my data, do I only use b? And if so what is the point of a?

Source Link
barnhillec
  • 219
  • 2
  • 9

Don't understand coefficients in MATLAB "butter" low pass result

I don't unstand the nature of the output in Matlab's "butter" command. Calling

[b,a] = butter(4, 0.5, 'low');

gives me two vectors, which the documentation says are b for numerator, and a for denominator, of the transfer function.

However plotting the frequency response of this transfer function with freqz() does not give me what I expected.

If I plot

freqz(b./a)

I see:

freqz of b over a

This is not a low pass filter, this is some sort of band stop filter suppressing the middle frequencies. However if I plot

freqz(b)

I see what looks like the low pass filter I was hoping for:

freqz of b only

So if I want to use a Butterworth filter to low pass my data, do I only use b? And if so what is the point of a?