I was wondering if there's a intuitive way to understand why sidelobes appear when performing an FFT on a signal of fixed length?
4 Answers
I have two explanations with the intent of providing additional intuitive insight beyond the concise mathematical explanation; first, an explanation from the Fourier Series Expansion along with the idea of repeating the truncated time domain sequence which shows the implied discontinuities that result, requiring more frequency components to reconstruct than would really exist if the waveform was not truncated. And second, an explanation from looking at the DFT as a bank of not-so-great filters.
First Explanation: Fourier Series Expansion and Time Periodicity
The Fourier Transform of a time limited sequence is identical to the Fourier Transform of a sequence that is periodic for all time.
This is true for the Fourier Transform as well as the Discrete Fourier Transform and is known as the Periodicity Property of the DFT:
Periodicity Property: Given the N-point DFT vector X[k], with an Inverse DFT samples x[n], with both k and n ranging from 0 to N-1; if n lies outside of the range of 0,1,2...,N-1, then
$x[n] = x[modulo(n,N)]$
Likewise, given a N-point time sequence x[n], with a DFT X[k], if k lies outside of the range of 0, 1,2,..., N-1, then
$X[k] = X[modulo(k,N)]$
To help gain an intuitive understanding, a key take-way is that anything that is sampled in one domain, becomes periodic in the other domain. Similarly, anything that is periodic in one domain, becomes sampled (discrete-valued) in the other domain. Here specifically, "sampled" means that the signal will only exist as non-zero values at discrete locations in the domain (stream of impulses).
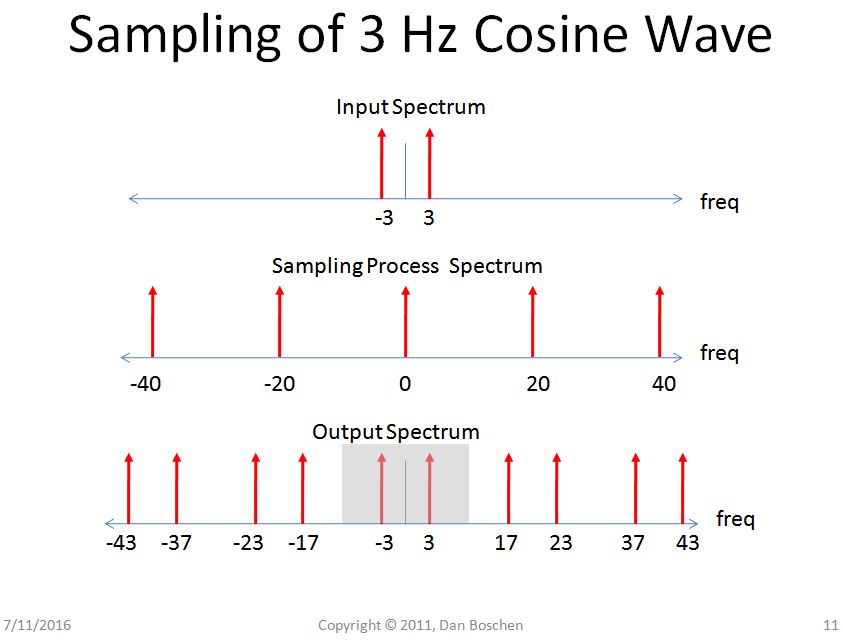
Sampling in One Domain -> Periodicity in the Other Domain: Consider the spectrum of a 3 Hz analog cosine wave before and after sampling with an A/D converter. The digital spectrum can be viewed as periodic; a cylinder view of the digital spectrum is also a valid view to explain the periodicity, but I find this extension to the analog frequency domain (by having the frequency extend to +/- infinity) helps some gain an intuitive view of the signal processing involved.
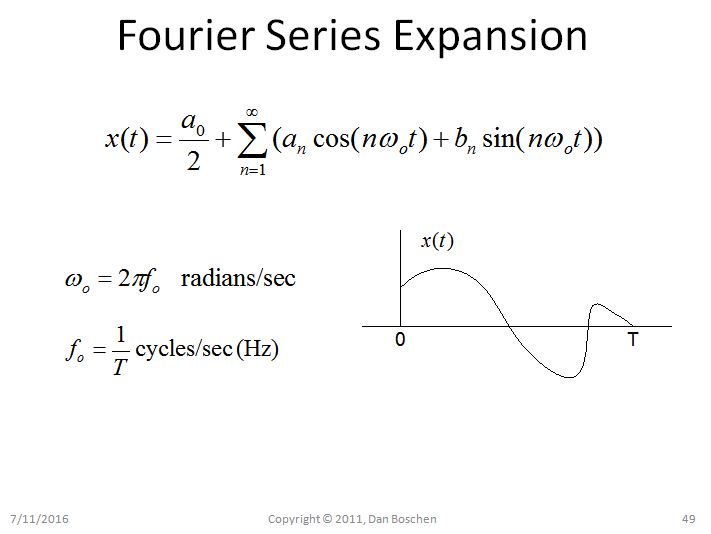
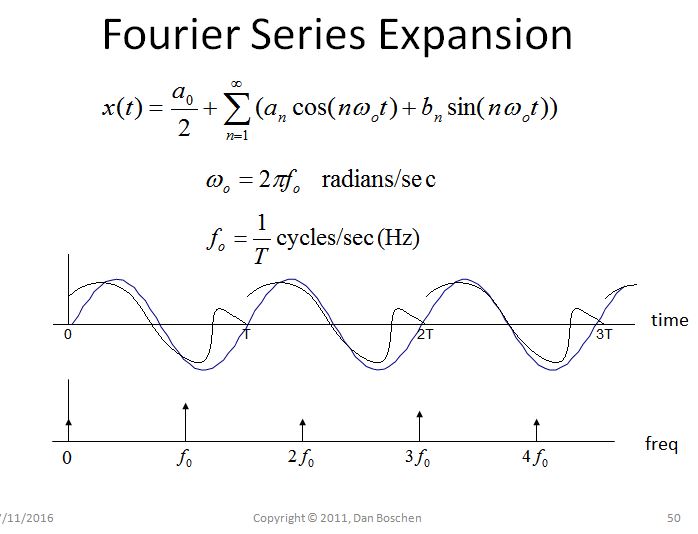
Periodicity in one Domain -> Sampling in the other Domain: Consider the Fourier Series Expansion as a simple example demonstrating this property. The Fourier Series Expansion is done over a finite time domain interval from 0 to T. When decomposed into separate frequency components, the only frequencies used are DC, the fundamental frequency 1/T, and integer multiples of 1/T (harmonics). In effect, since the frequencies can only exist at multiples of 1/T (and DC), the frequency domain has been sampled.
Further, if we reconstruct the time domain waveform, by summing together the individual frequency components, we can also view the implied periodicity in the time domain if we allow the frequency components to extend beyond the interval 0 to T. It is because of this periodicity that frequency components cannot exist at any other frequencies than multiples of 1/T (because of the opposite condition: if they did exist, then they would not begin and end consistently in the 0 to T time interval, and therefore periodicity cannot exist).
Understanding the above will hopefully help provide an intuitive explanation of spectral leakage. So now I will repeat a main point:
The Fourier Transform of a time limited sequence is identical to the Fourier Transform of a sequence that is periodic for all time.
Spectral Leakage with the "Fourier Series Expansion" View:
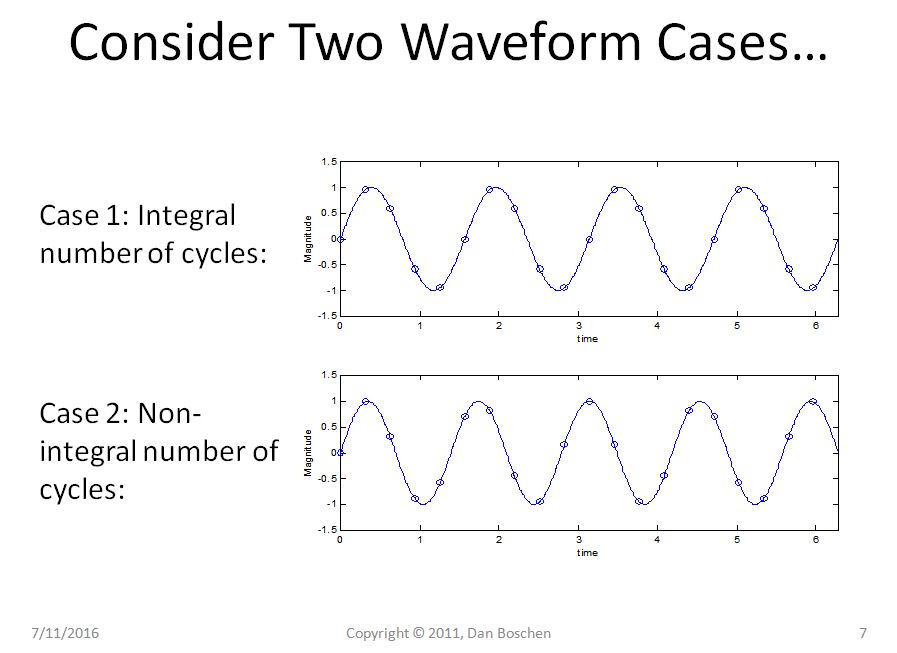
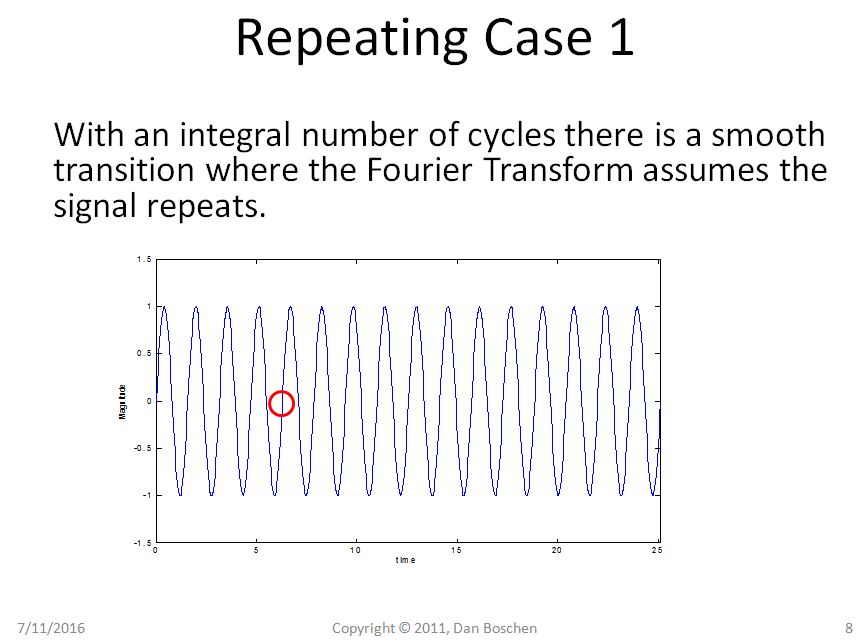
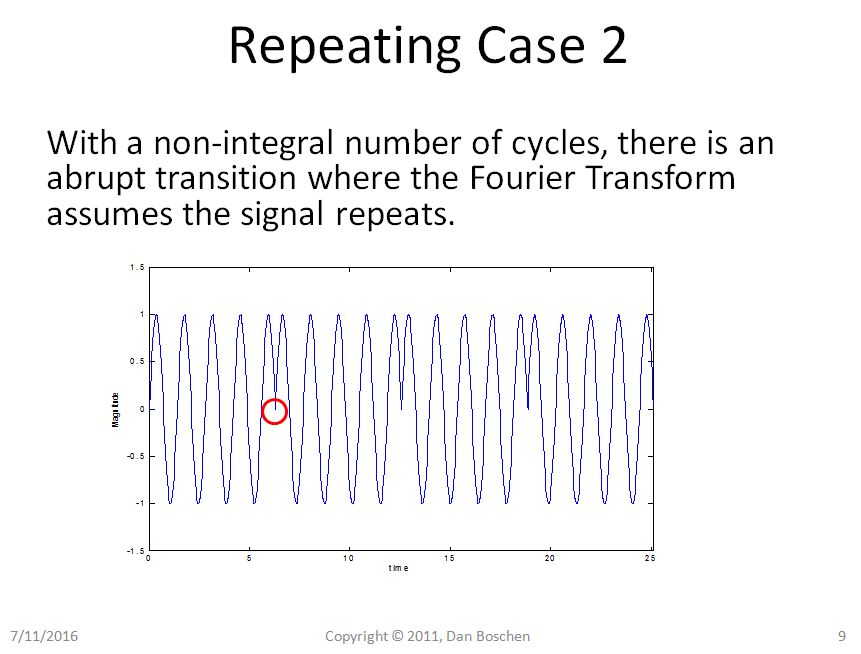
Consider two sinusoidal waveforms in the time interval from 0 to T, the first with an integer number of cycles over the time interval, and the second case with a non-integer number of cycles.
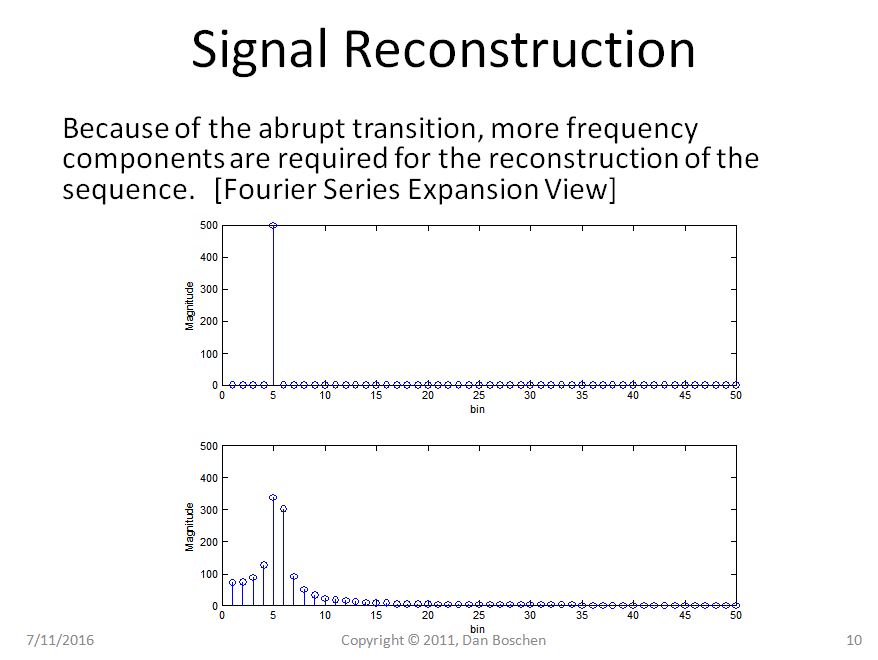
Clearly in Case 1 we can see with the repetition view that even repeating our pure sinusoid remains a pure sinusoid, but in Case 2 our sinusoid now suffers from abrupt transitions, and using the Fourier Series Expansion view of reconstruction, would requred several frequency components to reconstruct such a waveform in the time domain.
Second Explanation: Filter Bank View of the DFT
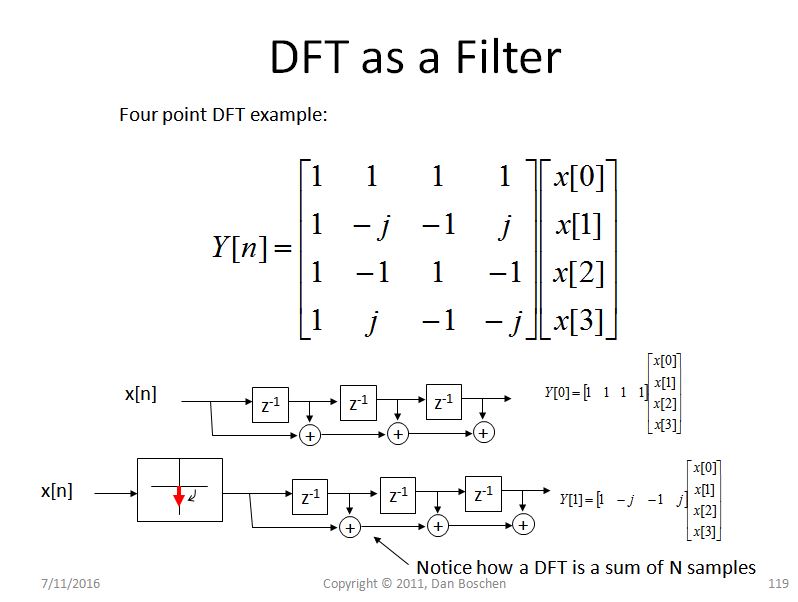
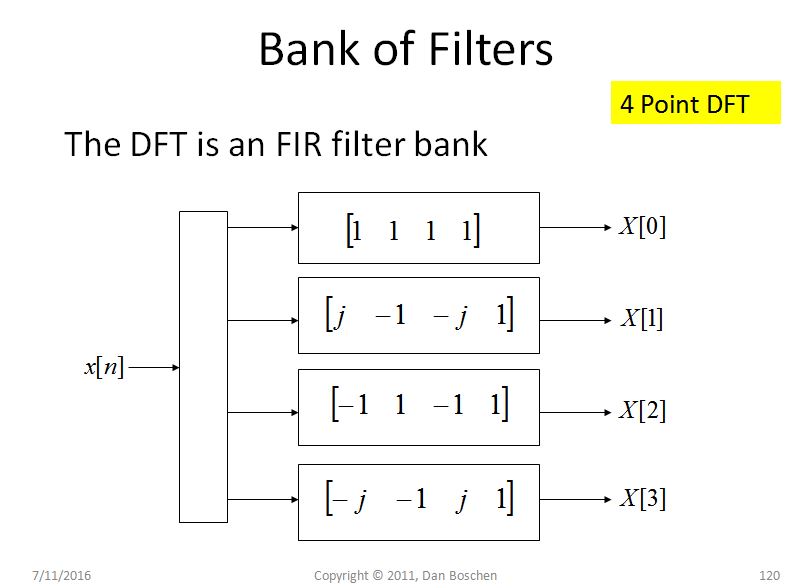
Another intuitive explanation for spectral leakage (and helps significantly with understanding the DFT in general) is what I call the filter bank view of the DFT. To see this, consider a simple 4 pt DFT as shown in the figure below and observe for each bin, we are effectively rotating the signal, and then passing the rotated values through a 4 tap unity gain FIR filter. For the first bin, which corresponds to DC, there is no rotation, so we just sum the four samples, and for the other bins we progressively rotate at higher frequencies as we move through the DFT bins:
(Side note- If we performed a streaming DFT, where we calculated a new 4 point DFT on a 4 point sequence as we scanned through a waveform, it would exactly be such a filter bank, but regardless if we do that or not, this view gives great insight into spectral leakage in addition to the usual convolving of a sinc function in the frequency domain that the mathematical explanation reveals)
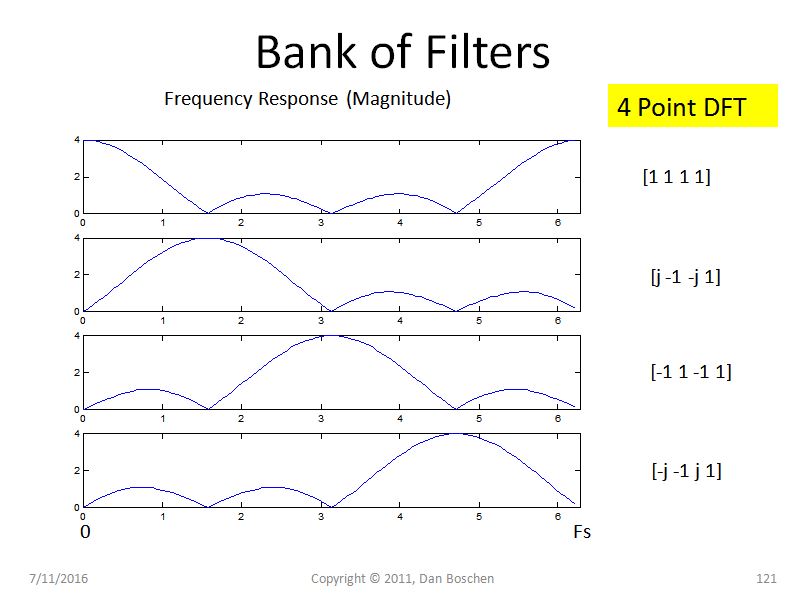
Now consider the frequency response for each equivalent FIR filter, using the coefficients given in the DFT (For example use freqz([coeff]) in MATLAB or Python) as shown in the figure below. (Note that the filter coefficients are in reverse order from that shown in the DFT matrix. This is because the coefficients of the filter are reversed in time; the earliest samples in time are at the far end of the FIR filter state register, so reversed in time):
Here is the main point: Since each Filter in the construction of the DFT is fundamentally an FIR filter with all unity coefficients, the shape of this filter in frequency approaches a Sinc function as the length of the DFT gets longer (and is an aliased Sinc function for small N). So we will call these Sinc filters and note that a Sinc filter has relatively high sidelobes and has an envelope that rolls off very slowly with frequency (at 1/f for a pure Sinc). With the phase rotators in the DFT, we just move the main lobe of this Sinc filter to each bin of interest, but the side lobes that exist for each bin allow frequencies at other locations to cause energy to appear in this bin. The amount of leakage is completely predicted by these filters.
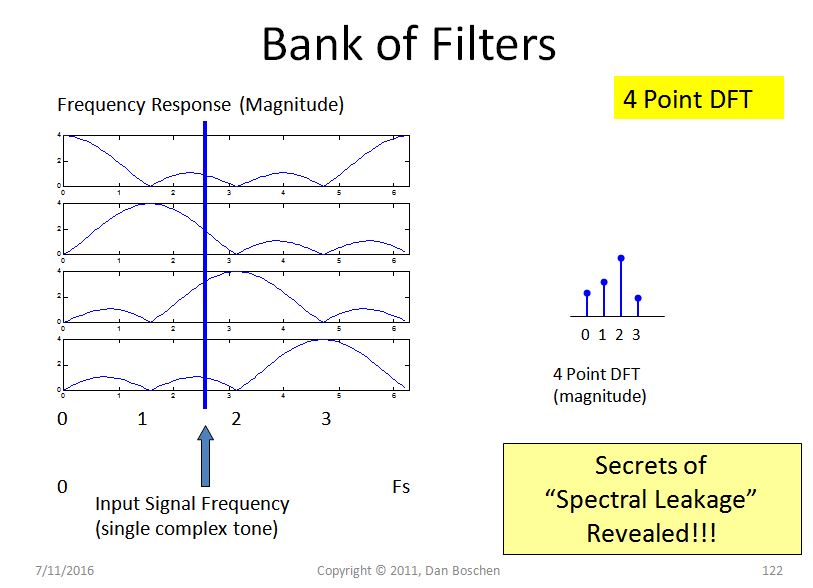
Using this view, consider an input single-toned signal with a frequency that is somewhere between two frequency bins as shown in the figure below (an input that exists exactly on any bin will have an integer number of cycles in the time domain interval and therefore NO spectral leakage as we showed earlier). The top filter shows the amplitude at this frequency location that will "leak" to the first bin. The second filter shows the amplitude (slightly higher), the third bin (that our frequency in closest to) will have the highest response and the fourth bin will be lower.
SUMMARY
I have presented two explanations with the intent of providing additional intuitive insight beyond the concise mathematical explanation of multiplication by a rectangular window in the time domain is convolution in the frequency domain (and the leakage we see therefore is the result of a Sinc function convolving in frequency with our waveform of interest that we truncated in time); first, an explanation from the Fourier Series Expansion along with the idea of repeating the truncated time domain sequence which shows the implied discontinuities that result, requiring more frequency components to reconstruct than would really exist if the waveform was not truncated. And second, an explanation from looking at the DFT as a bank of filters, and poor filters at that (specifically unity gain filters that approach a Sinc function frequency response as N increases). Such filters provide the best frequency resolution but poorest dynamic range.
-
$\begingroup$ You mentioned a term "we are effectively rotating the signal," .. but what i have studied & understand is that in Orthogonal transform of N signal samples with twiddle factor matrix.. instead of signal we use to rotate the basis vectors. If we have divided 2*Pi frequency space into 10 points (i.e doing 10 point dft) then we will rotate through different basis vector(represent different frequencies) & found cordinate of point(i.e particular sample) with respect to different basis vector fourier.eng.hmc.edu/e102/lectures/orthogonalTransform/….. $\endgroup$– user6363Commented Jun 2, 2017 at 11:09
-
$\begingroup$ continue from above ....and if we have different cordinate w.r.t to different frequency basis then we can have estimate how much frequency component is in each sample ... what i have got is right ? $\endgroup$– user6363Commented Jun 2, 2017 at 11:09
-
$\begingroup$ or you want to say is N*N matrix of twiddle factor is an bank of filter... which is capable to extract the different frequency content in each sample of signal ? $\endgroup$– user6363Commented Jun 2, 2017 at 11:11
-
2$\begingroup$ See this post where I explain the similarity between homodyning the signal (rotating the signal) and homdyning the coefficients (rotating the coefficient, which instead moves the filter to the signal: dsp.stackexchange.com/questions/41228/… $\endgroup$ Commented Jun 2, 2017 at 11:16
When you yank out $N$ samples of a sinusoid from a stream of samples of longer length (because all you can do is pass $N$ samples to the FFT), you are applying a window. The rectangular window.
Windowing is multiplication in the time domain. Multiplication in the time domain corresponds to convolution in the frequency domain. The side lobes you see is the result of convolving the Fourier Transform of the window function with the single spectral line that would be the Fourier Transform of the sinusoid.
I'm very slowly teaching myself DSP and have thought through similar questions. I hope a very simple explanation that will be useful to you is:
Each FFT bin represents exactly one specific frequency. So to represent a frequency that doesn't correspond to the exact frequency of a bin means it must be between two bins i.e. it will be smeared across two bins.
When you think about the fact an FFT can only be applied to part of the signal then there is typically a discontinuity at each end of the part of the signal you apply the FFT to. This is harder to explain simply, but I guess you could think of it as forcing the maths to introduce a ton of extra sine waves to model the discontinuity and you pollute more bins (this answers the question, the next bit about windows is an aside), so to mitigate this, a window is used to smooth out the discontinuity at each end but at the expense of changing the signal.
When I say frequency I mean sine wave of a given frequency, so Fourier analysis assumes you are thinking about your signal as a sum of sine waves.
The basis vectors of a DFT are all exactly integer periodic within the DFT aperture width. If your signal isn't exactly integer periodic within your fixed length, it can't be represented exactly and completely by any single frequency of DFT basis vectors. If your signal resembles a sinusoid, then it is often mostly represented by a single DFT result frequency bin (plus it's complex conjugate mirror image for strictly real input), but since it might not be an exact match in frequency, the left over, non-matching energy has to get represented somewhere for the DFT result to completely represent the signal. That left over energy goes into the side lobes.
If you subtract the best matching but exactly integer periodic sinusoid from your signal, the difference (might look something like a thin twisted triangle or bow-tie, try it) is what is represented or decomposed by the side lobes.
The shape of the side lobes is a Sinc (or more precisely, a periodic Sinc or Dirichlet kernel), since that is the transform of the rectangular window you get on any finite length signal.


